Wednesday, May 4, 2011

New Intraday Sell Signal


Past performance is not indicative of future results.

Thursday, April 28, 2011

Wal-Mart: Our shoppers are 'running out of money'

See full article

http://bit.ly/ieWLYG


Excerpt from CNNMoney.com:
Americans don't have the luxury of driving all over town to do their shopping.
Other than competing on prices and products, Duke said Wal-Mart is focused on leveraging technology -- especially social networking -- more aggressively to drive sales.
 "Social networking is much more a part of the purchasing decision," he said. "Consumers are communicating with each other on Facebook about how they spend their money and what they're buying."


FYI...


Scott Galloway
RT @: Tweethearts, what do you think? Is @'s class the only one that awards students for dominating Social Media?...

Wednesday, April 27, 2011

URANUS and the Stock Market

URANUS - In Pisces - 2003- March 10 2011
in Aries May 27 -2010 - August 13 2010  &   March 11 2011 - May 15 2018


Briefly we will find Uranus in Aries from May 27th 2010 then retrogrades on July 5th 2010 into Pisces and back to Pisces on August 14th. 2010  It will be direct on December 6th 2010  in Pisces. On March 12th 2011 it will be in Aries for eight years.

When it is in Pisces, it is  mysterious. It deals with the unfinished business.

The last time it entered Pisces, was from 1919 to 1927 ~ the Russian Revolution to the roaring twenties.  This time period should bring global government movement, solutions to problems that were unsolvable and more of understanding.

In Aries the fire sign.   The emphasis will be on independence and new beginnings.  It will give you some insight this year (2011) of how your life will change.  If there are areas in your life that need to be let go of or changed, Uranus will target them.  Unfortunately it can be an upheaval if you are living not positively.  It is a time also of spiritual tests and awakening.

Use this time to set your goals or even to reexamine your current ones.

We will find that it will open our selves and the world to new exciting innovations. New breakthroughs in science, medicine and mostly anything can happen during this period.

The last time it was in Aries was from 1927 to 1935  the stock market crashed and the great depression started.

Uranus is in each sign for 7 years.  


Full article can be found at      http://www.carlamary.net/UranusinPiscesandAries.html 

Past performance is not indicative of future results.

Tuesday, April 26, 2011

Two Forecast Charts for 2011 vs the Actual Market YTD...Update

Moon chart (top) Composite of all the "1" years of each decade (middle) SPX YTD (bottom)

Last update posted Wednesday, March 23,2011...

Again and for new readers:
"History doesn't repeat itself, but it does rhyme" - Mark Twain

The top chart is our Moon chart for 2011...
The second chart is a composite chart...
The third chart is the actual S&P500 YTD...
"So far" for 2011 the stock market seems to be following the multi-decade composite chart...
Don't discount the Moon chart altogether...look at the similar trend changes as compared to the YTD S&P500...


Other Updates:
Is the Stock Market Getting Ready Ready to Turn Soon?...Last post April 21,2011...
Today the DJIA made another recovery high...
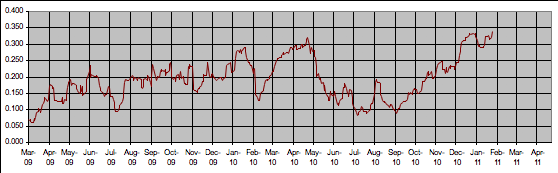
JNK 40.75 up 0.08
TLT 93.85 up 0.90
The JNK:TLT ratio got weaker again today while the market was up 115 points...
The negative divergence continues...


SPX vs McClellan Summation...Last post April 20,2011
The McClellan Summation has turned up and is still below the descending trend line...

Buy Signal...Last post April 20,2011
Still on a Buy Signal...The next signal will be posted when it happens...
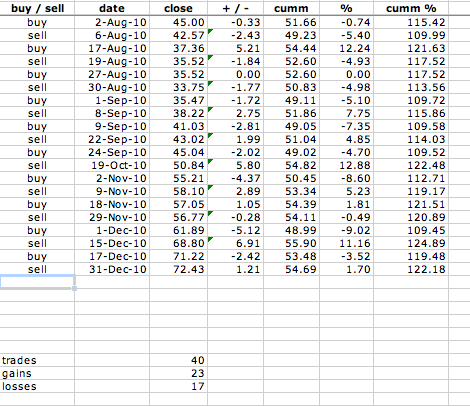
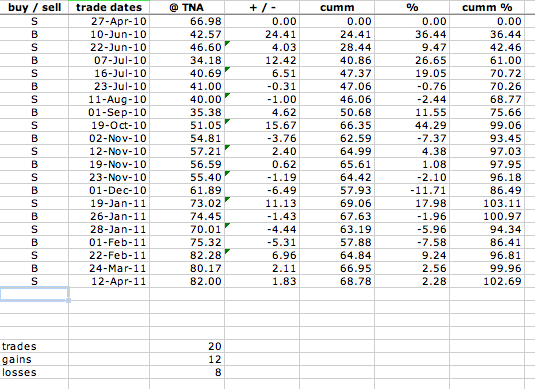
A note for new readers, this signal can get whip sawed while in a trading range...This is when losses will occur...The system is designed to keep losses to a minimum and to maximize gains by keeping us in trending markets...Refer to the last performance chart posted on April 20,2011...

Advisor Sentiment...Last post April 8,2011
Still experiencing Bullish readings...
In addition, Investors Intelligence has also reported recent Insider Selling at record levels...This has been historically negative...

Precious Metals Mutual Fund Market Cap vs GLD...Last post April 1,2011
No change in the comments...The Market Cap since April 1,2011 has not exceeded $150mil...When Gold and Silver started marching higher we thought that investors would be chasing it by buying the PM mutual fund and so far they did not...So is Gold and Silver going higher then?
If Gold and Silver go higher, investors will probably be tired of sitting out the rally and they will finally buy into it...maybe near a top...
If Gold and Silver go down, we may see investors sell their PM mutual fund and we may have a better base formed to continue an advance in both of these metals...


Past performance is not indicative of future results.

Thursday, April 21, 2011

Is the Stock Market Getting Ready to Turn Soon?...Update


JNK - SPDR High Yield Bond ETF
TLT - Barclays 20+ Year Treasury Bond ETF

Blue = JNK:TLT ratio turned before the DJIA
Pink = DJIA turned before the JNK:TLT ratio

A chart of JNK:TLT was last posted on Thursday, April 14,2011...
Todays prices:
JNK 40.64 +.07
TLT 93.00 +.32
It is very interesting with the Stock Market up (DJIA +32.58) that TLT is stronger than JNK...
This week the DJIA made a recovery high so we used this chart above and compared it to the JNK:TLT ratio chart...Note the divergences in these two charts when there was a  change in trend and it appears that we maybe in the middle of another divergence...
So far the S&P500, DJTA & Nasdaq have not joined the DJIA making a recovery high...Also JNK continues to be weaker than TLT...As long as JNK continues to be weaker than TLT, even if the other Stock Market averages make recovery highs, it increases the odds that we are forming a top...


Past performance is not indicative of future results.

Wednesday, April 20, 2011

SPX vs McClellan Summation...Update

McClellan Summation (top) vs SPX (bottom)
Note the rising tops in the SPX while the McClellan Summation has declining tops (pink line)...
This was last posted on Tuesday, March 15,2011...At that time the McClellan Summation was descending...Today the McClellan Summation turned up and we are watching to see if it finds resistance at or below the pink descending trend line or if it breaks through it to the upside...
Below is a chart of the NYSE vs McClellan Summation 2001, previously posted...


NYSE vs McClellan Summation 2001

This chart was on the McClellan Financial Publication website...Note that the pattern of the McClellan Summation for 2010-2011 is very similar to the 2001 chart...In 2001 the market finished the pattern with a September 2001 sell off...


Past performance is not indicative of future results.

Round and Round We Go, Where We Stop...

Excerpt from The Worden Report (Wednesday, April 20,2011)


By Peter Worden

www.worden.com

New Buy Signal


Past performance is not indicative of future results.

Tuesday, April 19, 2011

Quantitative Easing Explained

Sell Signal Market Update

On Wednesday April 6,2011 we said...
"After consulting with some of our astro charts, it looks like the market can potentially work its way sideways to higher into April 21st +/- and then correct into May 2nd +/-....
"If" this scenario works out, to some degree, then the market should rally into May/June...
Let the Trend Following Signals navigate us through this..."

This morning...
We were on a Buy signal from March 24,2011 when the above comment was posted...Then on April 12,2011 we issued a Sell signal...On April 12th the TNA was 82.00, TZA was 37.43 and this morning the TNA is trading at 82.94, the TZA is trading at 36.94...
What happened between April 6th and today was that the market tried to shake out as many traders as possible...So since our April 6th projection was not correct so far, we did do what we suggested and that was to "Let the Trend Following Signals navigate us through this..."  These signals have done a great job...

So what is next?  We are still on a Sell signal and we are going to wait for the next Buy signal from what ever level it occurs...Let's also see what happens with the rest of the astro projection from April21st +/- into May 2nd +/- (April 29 - May3)...


Past performance is not indicative of future results.

Friday, April 15, 2011

Sell in May and Go Away ? or Buy Yom Kippur, Sell Passover ?

Next week on the close of April 20th we will look at the daily MACD (12,26,9) for both the DJIA and the SPX...If the MACD is on a sell for both then according to Sy Harding we sell the position that was entered into last Fall 2010...
If the MACD is not on a sell signal for both, then wait until there is one and sell your long position...
Years ago Yale Hirsch founder of the Stock Trader's Almanac (see article below) did back testing and found that the best months to hold stock was from November through April...
Sy Harding and others found a way to fine tune the buy and sell during that period with the use of oscillators...On October 16th if the daily MACD (12,26,9) is on a buy signal you go long...If not you wait until the daily MACD changes to a buy signal...On April 20th if the daily MACD is on a sell signal you sell your long position...If not you wait until the daily MACD changes to a sell signal...
Sy Harding has had an excellent return using this one strategy over many decades...
In fact if you followed this strategy it would have kept you out of the 1987 crash, the 9/11/2001 crash, the 2008 crash and more recent it would have gotten you out in the second half of April 2010 before the May 2010 flash crash...
I am sure that there are many investors still trying to break even from the damage of the 2008 crash.
I highly recommend the book "Beat the Market the Easy Way" by Sy Harding.   You will learn many more strategies like this one from a seasoned investor...

********************************************************


Yale & Jeff Hirsch

About the Editor
Jeff is editor in chief of the Almanac Investor newsletter Stock Trader's Almanac, StockTradersAlmanac.com, and the Hirsch Organization. He makes frequent appearances on CNBC, CC, Fox, and Bloomberg. Yale Hirsch is founder of the Stock Trader’s Almanac.

Market Exodus – Bought Yom Kippur? Remember to Sell Passover
By Jeffrey A. Hirsch

                   Last year on September 10, market behavior around Rosh Hashanah and Yom Kippur was examined in a post titled “Sell Rosh Hashanah, Buy Yom Kippur, Sell Passover” noting that going long from Yom Kippur to Passover was very similar to the “Best Six Months” strategy which is be long November to April. Yom Kippur was on Saturday September 18, 2010. Going long at the close of the market on the day before through yesterday has been particularly profitable this year as the DJIA has gained 15.8%.
Read full post


Past performance is not indicative of future results.

Thursday, April 14, 2011

Is the Stock Market Getting Ready to Turn Soon?


JNK - SPDR High Yield Bond ETF
TLT - Barclays 20+ Year Treasury Bond ETF

When investors prefer to be in high yield bonds like JNK it is usually a good time to participate in the stock market...
When investors prefer to be in quality bonds like TLT it is usually not a good time to participate in the stock market ...
The second chart above shows the relative strength of JNK as compared to TLT...
This ratio has a tendency to confirm the turns in the stock market...
When investors prefer buying JNK this chart will go up and when investors prefer buying TLT this chart will go down...

As seen at the top of this blog, maybe it is best said as follows... "Confidence is contagious. So is lack of confidence" -Vince Lombardi


Past performance is not indicative of future results.

Wednesday, April 13, 2011

Tall Buildings Lead to Market Falls...Next, Mile High Skyscraper...

Tall buildings lead to market falls?
by www.equitymaster.com


"The bigger the better" is inbuilt in human psychology. This phrase holds maximum truth in real estate. Developers and industrialists are perpetually trying to outdo each other by building the "tallest buildings". This is not a recent trend. It has been around since 1916, when the Woolworth Building was completed in New York.

But the spooky fact is that when a highly publicized 'tall' building space gets launched, it is usually in the middle of a stock market crash. Don't believe us? Let's see some examples of this.

Period: 1930s

'Tall' Buildings: Sears Towers in Chicago, Empire State Building in New York

Source: Yahoo Finance

The Sears Tower as well as the Empire State Building were launched in 1930 and 1931 respectively. It was right when the Great Depression was setting in. From the peak in 1930, the Dow Jones Index crashed by nearly 86%.

Period: 1989

'Tall' Building: Canary Wharf Tower in UK

Source: Yahoo Finance

The Canary Wharf Tower was launched in UK in the beginning of 1990. Just in time for the 1990s recession in which the FTSE 100 fell by nearly 19%.

Period: 1997

'Tall' Buildings: International Finance Centre (IFC) in HK and Petronas Towers in Malaysia

Source: Yahoo Finance

The IFC was launched in Hong Kong in the middle of 1997. Just in the middle of the Asian Financial Crisis in which the Hang Seng Index (HSI) fell by 60%.

Source: Yahoo Finance

The Petronas Towers were launched in Malaysia in the middle of 1997. Just in the middle of the Asian Financial Crisis in which the Kuala Lumpur Composite Index (KLCI) fell by 77%.

Period: 2010

'Tall' Building: Burj Khalifa in Dubai


Source: Khaleeja Times

The world's tallest building Burj Khalifa was launched on 5th January, 2010. Dubai financial markets were already reeling with the headwinds surrounding its property developers. The Dubai financial markets (DFM) declined by 34%.

Spooky isnt it?

So why does it happen? Interestingly, it is the increased liquidity in the system that fuels such fantasies, which industrialists seek to convert to realities. The economy is going great guns. Investors are in a euphoric mood. Money is easily available through loans and private equity funds. All this euphoria clouds the thinking of the developers, who then start aiming for the heights.

But, as these fantasy projects start taking shape, the economic mood is generally turning towards the worse. By the time these projects are completed, the economy starts slipping into recession and these monuments start serving as a gloomy reminder through their empty floor spaces and vacant expressions.

History has proved this fact time and time again. But interestingly, history is always ignored as developers get back into these fantasy moods claiming "this time it's different".

Recently an Indian developer, Lodha Builders, has decided to build the world's tallest residential building. We are sort of hoping that the jinx breaks in India and history does not repeat itself. Hopefully, 'this time it is different'.


Saudi Arabia Plans For Mile-High Skyscraper

mile-high-tower.jpg
A mile? That's not even scraping the sky anymore -- that's an open-palm grope!
Because building a tower taller your neighbor's is making a comeback in proving your superiority (God, whatever happened to a good ol' fashioned pissing contest?!), Saudi Arabia plans on building a $30-billion(!!!!!!) skyscraper that's almost twice as tall as Dubai's current record-holder, the Burj Khalifa (828 m; 2,717ft) with a tower a full mile high (1,600 m; 5,280 ft). *shivers* YOU'RE GOING AGAINST NATURE.
Prince Al Waleed Bin Talal, head of Kingdom Holding Company recently gave his approval for construction of what will be billed as the world's tallest man-made structure -- the Kingdom Tower.
Designed by Adrian Smith, the Kingdom Tower will be built in Saudi Arabia's city of Jeddah. The tower will stretch one mile up into heavens and include 12 million cubic feet of space, several stories of office space, several stories for a hotel and four tiers of residential space, with the upper most tier reserved for "alternative energy generation" solutions (perhaps including a pendulum to keep the entire tower from collapsing).
An elevator ride to the top is expected to take about 12-minutes, which is 11-and-half minutes longer than I could ever hold a fart trying to be a decent human being. Geez -- could you imagine getting to the bottom and realizing you left something upstairs? You'd have to just leave it OR IT'S ANOTHER 24-MINUTES BEFORE YOU'RE BACK DOWNSTAIRS. That's a f***ing commute and you haven't even left the building!
Hit the jump for a shot of the building's layout, as well as a video about it.
tower-layout.jpg

Kingdom Tower will make the Burj Khalifa look short, reach one mile up
[dvice]
Thanks to Thomas, who likened the building to the Tower of Babel. Really?


Tuesday, April 12, 2011

New Intraday Sell Signal


Past performance is not indicative of future results.

Friday, April 8, 2011

Advisor Sentiment Report

Advisors Sentiment By Investors Intelligence April 5,2011
The Advisors Sentiment Report has been calling major market turning points since 1963, and has always been closely followed by the financial media.  This week, CNBC featured the report – you can read about it here.
When the survey was developed by founder, AW Cohen, he originally expected that the best time to be long in the market was when most advisors were bullish,  This proved to be far from the case – a majority of advisors and commentators were almost always wrong at market turning points.  Quite simply, professional advisors are just as susceptible to market emotions as individual investors – they become far too greedy at the top of trends and far too fearful near the bottom.
 
Extreme readings, as we are experiencing right now, historically have major significance so if you don’t already subscribe*, just click here to read more and add the Advisors Sentiment report to your investment research tools.
 
*Current subscribers to the Advisors Sentiment report can login to www.investorsintelligence.com to read this weeks report in full.


Past performance is not indicative of future results.

Thursday, April 7, 2011

Stock Market Signals Update

The following was posted on March 24,2011...
The TNA was 80.17 then and today it is trading around 92.25...
The Trend Following Signal is still on a buy and we will post the sell signal when we get one...

Thank you to everyone that has made this blog successful !
The stats on this blog are very high so I know that we are being followed closely.
If you think that this blog can be helpful to others then please pass the word on to them.
Thank you again!


Posted...Thursday, March 24, 2011

A new buy signal today...

Trend Following signals will get us on the right side most of the time so we do not have to guess where the market is going, because, we know that the market is going to do whatever it wants to do whenever it wants to do it...
We keep our emotions out of our decision making process when using Trend Following signals...


New Buy Signal


Past performance is not indicative of future results.

Wednesday, April 6, 2011

More Market Comments

After posting the Market Alert comments earlier today we took another look at the SPX pattern between December 2009 and February 2010...Notice that the market kept grinding a little higher into January 2010 before it corrected into February 2010...
After consulting with some of our astro charts, it looks like the market can potentially work its way sideways to higher into April 21st +/- and then correct into May 2nd +/-....
"If" this scenario works out, to some degree, then the market should rally into May/June...
Let the Trend Following Signals navigate us through this...
So far, since April 27,2010 the signals performance has had net gains of about 100%...
Watch for more updates on this...

Past performance is not indicative of future results.

Market Alert

Today Investors Intelligence reported Advisor Sentiment numbers...
Bulls moved up to 57.3%
Bears dropped down to 15.7%
Corrections increased to 27.0%

One of the calculations used to analyze Advisor Sentiment numbers  is the spread between the Bulls and the Bears...Today the spread increased to 41.6%...It was 42.4% in October 2007 at the all time high in the DJIA...

Note that the Bears were 15.6% in December 2009 before the market correction into February 2010...The market then rallied into April 2010 before the sell off into the June/July 2010 bottom...

We think that we may have an April/May sell off and then a rally to a May/June top...

But, we will continue to let our Trend Following Signals guide us through the market since it has been doing a very fine job so far...


Past performance is not indicative of future results.

Saturday, April 2, 2011

Gold Gold Gold, Long and short term Market Update

Gold Chart By AstroCycle.com
You can see the 40 year cycle  clearly on this chart above in addition to an 8 year cycle.   In my reading of the work of Samuel J Kress Jr, he said that the 40 year cycle has special significance in that it can be divided by two Fibonacci numbers, 5 and 8....
Using the 8 year cycle the next projected high is in the year 2012 and the next projected low is in the year 2016...and then another high in the year, 2020...The last cycle low was in the year 2000 and the next projected high is due in the year 2020...
Fibonacci price targets are noted as well...


Past performance is not indicative of future results.

Friday, April 1, 2011

Precious Metals Mutual Fund Market Cap vs GLD...Updated

Turquiose = Precious Metals Mutual Fund Market Cap
 
The last time this chart was updated was on February 18,2011...
The markets usually advance while leaving most traders behind...
Most investors/traders buy and sell at the wrong times...
You can see this clearly in the above chart...
When there are large redemptions in this PM mutual fund the price of GLD bottoms...
When the price of GLD moves up the investors chase it and buy the PM Mutual Fund...
So the PM Mutual Fund was being bought and sold at the wrong times...
Currently GLD moved up and investors do not look like they are chasing it yet...
This makes me believe that GLD may be moving higher...
When investors start chasing GLD by buying the PM Mutual Funds, the caution flag will be waving again...

Let's wait and see...

Past performance is not indicative of future results.

Thursday, March 31, 2011

Long & Short Mutual Funds Ratio


March 1, 2009 through March 31,2011
 
This chart has not been updated since the January 25,2011 posting...
This chart is from March 2009 to the present...
It is the ratio of the market cap in long funds divided by the market cap in long funds plus the market cap in short funds...
Note that this ratio is currently higher than the level it was in April 2010 before the market corrected into July 2010 and it is currently back at the same level it was in February 2011 before the market corrected into March 2011...
This does not mean that the market has to correct now, it can advance from here, but, we should exercise some caution...
Note that the market will always do what the market wants to do...
It will always try to influence investors to buy near the top and sell near the bottom...
We are still holding our long position from the Trend Following Buy Signal of March 24,2011 and we will wait for a new signal before we reverse our position... 
 
Past performance is not indicative of future results.

Tuesday, March 29, 2011

Stock Market Comments by Martin Pring

In reviewing old notes, this comment made by Martin Pring was worth publishing here...

This is a paraphase...

The average cyclical Bull market during a secular Bear has been 34 months...
Excluding the three big rallies 1932-1937, 1942-1946 and 2002-2007 the average is 27 months...
Markets alternate, so the long rally of 2002-2007 will probably be followed by a shorter rally than normal...    By Martin Pring...

So, if you add 27 months to the March 2009 bottom you get June 2011.


Past performance is not indicative of future results.

Saturday, March 26, 2011

THE BENNER CYCLE, FIBONACCI NUMBERS & THE NUMBER 56

THE BENNER CYCLE, FIBONACCI NUMBERS & THE NUMBER 56 by David McMinn

The full article can be located at:
http://www.davidmcminn.com/pages/brenfib.htm

There are several extremely interesting subjects discussed...
One that I took note of was the 36ysc (year sub-cycles)
It may be a reason why the "Buy and Hold vs Trading in the Stock Market and the 18/36 Year Cycles"... posted on March 18,2011,  worked...

The following web address will take you to another great article on...Fibonacci Time Sequences
http://www.tsing.com/theory/lesson25.htm

To see other Lessons, just change the number in the web address...

Thursday, March 24, 2011

New Buy Signal

A new buy signal today...

Trend Following signals will get us on the right side most of the time so we do not have to guess where the market is going, because, we know that the market is going to do whatever it wants to do whenever it wants to do it...
We keep our emotions out of our decision making process when using Trend Following signals...


Past performance is not indicative of future results.

Wednesday, March 23, 2011

Stock Market Signals Update

Our last signal was a sell signal on February 22,2011...
Just so you know...as of today we are still on this sell signal...
If the signal changes it will be posted here as soon as possible...

For new readers, our trend following signals do NOT catch tops and bottoms...In fact they may even get whipped sawed in a trading range...BUT, they will keep us in trends when they develop...If you look at some older postings on this blog (February22,2011) you will see the performance chart...In less than one year, from April 2010 to February 2011, there were 18 trades, 10 were gains and 8 were losses, and there was a cumulative net gain of 96%...We went long TNA on buy signals and we went long TZA (an inverse ETF) on sell signals...To keep it simple the performance chart is based only on the TNA...
Again this performance is mainly due to the system keeping you in the trade during a trending market...


Past performance is not indicative of future results.

Two Forecast Charts for 2011 vs the Actual Market YTD

The top chart is our Moon chart for 2011...
The second chart is a composite chart...
The third chart is the actual S&P500 YTD...
For many years the Stock Traders Almanac rated each year of the decade from best to worst...
Some years seem to follow the Moon chart best and some years follow the multi-decade composite best...
We prepare both charts and in some cases a few other charts as well, like the Bradley Indicator, and then see which chart the market seems to be following the best...
"So far" for 2011 the stock market seems to be following the multi-decade composite chart...
Don't discount the Moon chart altogether...look at the similar trend changes as compared to the YTD S&P500...

"History doesn't repeat itself, but it does rhyme" - Mark Twain


Past performance is not indicative of future results.

Tuesday, March 22, 2011

Market Cap as a % of Nominal GDP

TheChartStore.com
See   ---->    http://bit.ly/eNIA2j

http://www.smithers.co.uk/page.php?id=34


Both charts show descending tops since the year 2000...

Also see post on Monday, February 7, 2011
Long Term Cycles, Depressions and Stock Market Bottoms - Part I


Past performance is not indicative of future results.

MMA Comments for the Week Beginning March 21, 2011

http://bit.ly/eqoOpI     <----for full comments for the week of March 21,2011

Written by Raymond Merriman  

Excerpt from - "Short-Term Geocosmics"
The stock market appears to be following the Jupiter cycle very well, as presented in the Forecast 2011 Book.  In this filtering of Jupiter’s transit through the signs going back to the 1870’s, the DJIA tops out around the time it enters Aries (January 22), bottoms around the middle degrees of Aries (within a couple weeks of April 1, which is also very close to the 20-year Jupiter-Saturn opposition of March 28), and rallies again to another top around its ingress into Taurus (June 4). Is the bottom in yet or will it reach a 10% decline? Will it then rally to a new yearly high in early June, or fall short? That will be the subject of this week’s MMA Cycles Report.

Past performance is not indicative of future results.

Sunday, March 20, 2011

67 Trading Day (TD) Cycle Highs


This chart was seen on the Raj Times and Cycles blog posted on March 14,2011...
      http://bit.ly/dPHOw3
The 67 TD cycle is roughly equal to a 14 week cycle...
This is very interesting seeing how numerology assisted in the calculation of forecasting highs in the stock market...

Past performance is not indicative of future results.

Friday, March 18, 2011

Investors Are Starting to Get Nervous About the Current Market...

Money Market Funds (MMF) Show Big Deposits This Week...
 (Re: Only One Family of Funds)

When investors get nervous about the markets they make mutual fund switches...
At the March 2009 bottom of the market investors had been switching cash from mutual funds to a  MMF... At March 2009 the MMF deposits had grown to $1.365Bil...
As the stock market advanced to higher levels since the March 2009 bottom, the amount of funds in the MMF started dropping as investors switched their cash from MMF's and put it in to other mutual funds...
When corrections occurred investors got nervous and made switches back to MMF's...
Then when the market continued it's advance investors switched back from MMF's back into mutual funds again...This occurred several times until the latest top in February 2011 while leaving the MMF with $659mil, the lowest amount since March 2009...
So for the last 23 months as the stock market catapulted up the amount of cash in the MMF ratcheted down from $1.365Bil to $659mil...
From the top in February at DJIA 12,391 to the low this week of DJIA 11,667 there was a 724 point swing...
Although the market closed today at DJIA 11,858 investor nervousness was growing and they switched from mutual funds back to the MMF...A total of $233mil was switched to the MMF from mid February 2011 and $186mil occurred this week alone...

Buy and Hold vs Trading…in the Stock Market and the 18/36 Year Cycles


Buy and Hold vs Trading…in the Stock Market and the 18/36 Year Cycles

1910+18yrs = 1928 (buy & hold ends) + 18yrs =1946 (buy and hold starts)
1910 DJIA @ 57 to 1928 DJIA @ 280 = 391%  / 18yrs = 22% , based on the index in the initial year
Compound Annual Growth Rate (CAGR) = 9.25%
Note that in:
1929 the DJIA was @ 400
1932 the DJIA was @ 40

*From 1928 @ DJIA 280 to 1946 @ DJIA 170 was not a buy and hold period

1946 +18 yrs=1964 (buy and hold ends) + 18yrs=1982 (buy and hold starts)
1946 DJIA @ 170 to 1964 DJIA @ 880 = 417%  / 18yrs = 23% , based on the index in the initial year
Compound Annual Growth Rate (CAGR) = 9.56%
Note that in:
1973 the DJIA was @ 1050
1974 the DJIA  was @ 600

*From 1964 @ DJIA 880 to 1982 @ DJIA 800 was not a buy and hold period

1982+18yrs = 2000 (buy and hold ends) + 18yrs = 2018 (buy and hold starts)
1982 DJIA @ 800 to 2000 DJIA @ 10,500=1212% / 18yrs=67%, based on the index in the initial year
Compound Annual Growth Rate (CAGR) = 15.38%
Note that in:
2007 the DJIA was @ 14,400
2009 the DJIA was  @  6,500
* The above does not preclude the DJIA from testing the 6,500 bottom of March 2009

*From 2000 @ DJIA 10,500 and forecast to 2018 @ DJIA forecast at 9,500 forecast not to be a buy and hold period…

2018   +   18yrs   =   2036 (buy and hold ends)
Forecast 2018 DJIA @ forecast 9,500 to forecast 2036 DJIA @ forecast 47,500 = 400% = avg of 22% per year (forecast based on the first and second scenarios above)
Forecast Compound Annual Growth Rate (CAGR) = 9.25%

Although the above 18/36 year cycles forecast calls for the next Buy and Hold period to start in 2018, we are forecasting other projected bottoms to occur in 2014 and 2016...

In summary, there were periods where Buy and Hold of equities performed very well and there were periods where Buy and Hold of equities was not the preferred asset class  investment...
During the Buy and Hold period equities were the asset of choice...
During the Non-Buy and Hold period Gold was one asset of choice...
In the current Non-Buy and Hold period (2000-2018), so far, Gold has also been the asset of choice...


Past performance is not indicative of future results.

Thursday, March 17, 2011

12,400 -- An Important Level the Dow Hasn't Broken


This chart was created by the people at Elliott Wave International...

An interesting article about this chart can be found at:

http://bit.ly/gTsS93


Past performance is not indicative of future results.

Tuesday, March 15, 2011

SPX vs McClellan Summation

SPX vs McClellan Summation 2010-2011
Note the rising tops in the SPX while the McClellan Summation has declining tops (pink line)

NYSE  vs McClellan Summation 2001

This chart was on the McClellan Financial Publication website...Note that the pattern of the McClellan Summation for 2010-2011 is very similar to the 2001 chart...In 2001 the market finished the pattern with a September 2001 sell off...

How will the 2010-2011 pattern be resolved?

Past performance is not indicative of future results.

Monday, March 14, 2011

Market Update

On March 10th we wrote:
The SPX broke out of the triangle to the downside and we are now challenging the 55 DMA...
and it looks similar to late November early December...But is it?
Seeing two options here...One, we find some support and turn up and the rally continues or, two, we find support, turn up and we bounce off of the lower triangle trend channel and continue going down...

Based on our previous posts of a correction in March, today we are favoring the latter scenario...Let's watch and see how the pattern develops...

Today:
We now know that we broke through the 55 DMA and we did not bounce off of it...

From our previous post suggesting a correction in to the end of March +/- and then a rally in to Mid May +/-...We still think that this is possible...Also possible is a bounce from wherever this pullback finds support...

As discussed several times, trying to forecast what the market will do and when it will do it is a blast especially if it turns out right...But the market will do what ever it wants to do when ever it wants to do it...So I still prefer to use Trend following signals to buy and sell the market...Trend Following does not pick tops and bottoms and occasionally can get whip sawed when in a trading range...But when in a trending market it will keep you in the trend...

Note that our last signal was a sell signal on February 22,2011...


Past performance is not indicative of future results.

Thursday, March 10, 2011

Today's Chart of the S&P500


On March 8th we wrote:
On today's chart of the S&P500, it looks like a triangle is forming...
With our signals still on a sell signal, it is possible that resistance maybe held at the upper trend line of the triangle and will continue down out of or near the apex...
If the break out is to the upside AND our signals reverse from short to long we will reverse our position and go long...

Today the SPX broke out of the triangle to the downside and we are now challenging the 55 DMA...
and it looks similar to late November early December...But is it?
Seeing two options here...One, we find some support and turn up and the rally continues or, two, we find support, turn up and we bounce off of the lower triangle trend channel and continue going down...

Based on our previous posts of a correction in March, today we are favoring the latter scenario...Let's watch and see how the pattern develops...


Past performance is not indicative of future results.

Wednesday, March 9, 2011

'Astounding' Trading Accuracy Using Twitter

Interesting article yesterday on the CNBC website...

http://bit.ly/fV9ipa

After you read this article then re-read the following sentence taken from the "When Your Money Is the Dumb Money" article...See the March 8,2011 post...

"I know, I know. Believing that we can remove all emotion from our decision making just isn't realistic."

Mmmm...Individuals mood swings are being read via Twitter and with a 3-4 day offset is being used to predict the movement in the stock market ...

The NYSE is the largest arena that displays human emotions...

So, if you do not have access to this information, take the emotion out of trading by using Trend Following to trade the market...


Past performance is not indicative of future results.

Tuesday, March 8, 2011

NYT...When Your Money Is the Dumb Money

Interesting article on Yahoo! Finance today from the March 7,2011 New York Times...

http://yhoo.it/dYKZ2B

It is short, so take a minute and please read it...

The Precious Metals posts on this blog have mentioned that when large redemptions were made in the PM mutual fund that PM prices bottomed in that time frame and then reversed direction...So individuals sold this PM mutual fund at the wrong time...Sure, they will get back in, but, probably at higher prices...

Past performance is not indicative of future results.

Todays Chart of the S&P500


On today's chart of the S&P500, it looks like a triangle is forming...
With our signals still on a sell signal, it is possible that resistance maybe held at the upper trend line of the triangle and will continue down out of or near the apex...
If the break out is to the upside AND our signals reverse from short to long we will reverse our position and go long...

Past performance is not indicative of future results.

Wednesday, March 2, 2011

Precious Metals Comments


On the top is a chart of GLD...
Below it is an oscillator...
Take a look at the oscillator in January 2011...It is oversold at -80...
Take a closer look and you will see the oscillator turning up while the price made a new low...
This is positive divergence which is bullish...

Note that after large January 2011 redemptions in the PM mutual fund, see posts on February 18,2011,  the fund dropped to about $125mil from about $250mil...the price of GLD bottomed a couple of days later at 127.80 and today it closed at 139.91...
Fear took over when GLD dropped from 139.00 in December 2010 to 128.00 in January 2011...So the fund was sold at the wrong time...
Using the oscillator together with the large redemptions of the PM fund told the story for GLD...
Today the PM fund is $150mil...


Past performance is not indicative of future results.

Tuesday, March 1, 2011

Commentary on the Market Signals

The last signal was a sell signal on February 22nd...
We were close to a reversal today, but, we did not get one...
Even if our forecast on February 27th is ultimately correct or not, it does not matter as long as we religiously follow our signals...
We do not want to get caught up in the emotional volatility swings of the market...This is when it is easy to let our emotions of fear and greed take over our trading instead of letting our signals do the job they were created to do...

To review our strategy:
JustSignals only trades based on the signals...
That is our trigger to take a position and our stop when the signal reverses...
We then sell our current position and take a new position in the direction of the new signal...

Making forecasts are a blast, especially if they come out right, but, we should not get fixated on future changes in trends or price targets that are forecasted...They may not come to fruition...


Past performance is not indicative of future results.

Wednesday, February 23, 2011

Precious Metals Comments

To review...
After large January 2011 redemptions in this PM mutual fund..the fund dropped to about $125mil from about $250mil...the price of GLD bottomed a couple of days later at 127.80 and today it closed at 137.51...
So the fund was sold at the wrong time...

Past performance is not indicative of future results.

Tuesday, February 22, 2011

New Intraday Signal


A new sell signal today...

Trend Following signals will get us on the right side most of the time so we do not have to guess where the market is going, because, we know that the market is going to do whatever it wants to do whenever it wants to do it...
We keep our emotions out of our decision making process when using Trend Following signals...


Past performance is not indicative of future results.

Saturday, February 19, 2011

Precious Metals Comments

Silver traded close to a 30 year new high this week...
For those of you who want to trade both gold and silver but are undecided how to allocate your position to each one, you can buy the CEF...I believe CEF allocates 2/3 to gold and 1/3 to silver...So you can get the best of both worlds...
The GLD ETF was up +.37 Friday and the daily price chart still looks like an ascending wedge...
Soon we will see how it breaks out of that pattern...

Past performance is not indicative of future results...

TNA Signals

Nothing new here...Still on the last buy signal from Feb 1,2011...
TNA was 75.32 back then and it closed at 86.45 on Friday Feb 18,2011...
Not bad for Trend Following signals...

Past performance is not indicative of future results.

Friday, February 18, 2011

Precious Metals Comments

Turquiose = Precious Metals
In the Feb 15th chart you will see that the PM turq line is starting to turn up with a steeper slope than the past three times after big redemptions...On today's chart above you can see a sharper rise in investor/trader buying of this Precious Metals mutual fund...The markets usually advance while leaving most traders behind...Most investors/traders buy and sell at the wrong times...Why are investor/traders buying into the PM mutual fund now?
To review, after the large redemptions in this PM mutual fund the price of GLD bottomed a couple of days later at 127.80 and today it closed at 135.04...So the fund was sold at the wrong time...
The daily price chart of GLD is overbought and the chart pattern looks like an ascending wedge, while the weekly price chart of GLD is oversold...Wouldn't mind seeing the price of GLD break out of the apex of the ascending wedge to the down side and get over sold one more time...

Let's wait and see...

Past performance is not indicative of future results.

Thursday, February 17, 2011

Solar Flares

http://news.bbc.co.uk/2/hi/programmes/newsnight/9020059.stm

The sun has an 11 year activity cycle that is due again in the 2012-2013 time period...
The Mayan Calendar ends on Dec 21, 2012...
Mmmmmm

Precious Metals Comment

In the post of Feb 16th you will see that the PM turq line is starting to turn up with a steeper slope than the past three times after big redemptions...This indicates investor buying of this PM mutual fund...The markets usually advance while leaving most traders behind...Why are investor/traders buying into the PM mutual fund now?  
May be we did not see the bottom in PM yet?   Let's wait and see...

Past performance is not indicative of future results.

Wednesday, February 16, 2011

Precious Metals Market Update...Gold

Here is the current chart as of Feb 15,2011...


This chart starts at March 2009...
Turquoise = Precious Metals Mutual Fund...(Don't pay attention to the arrow in this chart)

A great note for all markets... "The bull market does what it's supposed to do - advance while leaving most traders and Johnny-come-latelies behind."          

Past performance is not indicative of future results.

Tuesday, February 8, 2011

Precious Metals....OB/OS Update

From the January 24,2011  post

On Jan 27th GLD hit a low of 127.80 and today at noon it is selling at 133.30.


Comments from the January 24,2011 post:

This chart starts at March 2009...
Turquoise = precious metals mutual fund...note that after investors sharp redemption's, a bottom in the price of gold formed (this chart does not have the price chart for gold...please compare this chart to a gold chart and match up the dates)...It is easier to spot bottoms than tops...
Again there were a lot of redemption's in this Precious Metals mutual fund...

Past performance is not indicative of future results.

Monday, February 7, 2011

Long Term Cycles, Depressions and Stock Market Bottoms - Part I


Read more about the above chart at...http://www.smithers.co.uk/page.php?id=34
q and CAPE charts... indicate an oversold and or undervalued market...So when will this chart become oversold and or undervalued again?

A full cycle between lows (1932-1848ish=84yrs) a half cycle of 84yrs would be 42yrs...This is the same difference between the following lows (1974-1932=42yrs)...
So...applying a full cycle of 84 yrs...1848ish+84=1932+84=2016 suggests the year of a possible bottom...
Applying a half cycle from the last major bottom...1974+42=2016 suggests the year of a possible bottom...
Applying the nominal 40yr cycle from the last major bottom...1974+40=2014 which suggests another year of a possible bottom...
Or will there be a bottom in both 2014 and 2016?
That is a very good possibility with a flat to up market during 2015...since this has been the story with every 5th year of a decade for the last 100 years...
Approximate long term cycle lengths may be explained as outer planetary cycles...which are also forecasting bottoms in the years 2014 and 2016...

Past performance is not indicative of future results.

Sunday, February 6, 2011

SuperBowl Stock Market Indicator

I saw this indicator first introduced by Louis Rukeyser on Wall $treet Week years ago...

What Does Super Bowl Indicator Mean?
An indicator based on the belief that a Super Bowl win for a team from the old AFL (AFC division) foretells a decline in the stock market for the coming year, and that a win for a team from the old NFL (NFC division) means the stock market will be up for the year.

Investopedia explains Super Bowl Indicator
Chalk it up to coincidence, but this indicator has been surprisingly accurate (around 85% correct) over the past years. Even so, you probably shouldn't bet the farm on it.

http://www.investopedia.com/terms/s/superbowlindicator.asp

Past performance is not indicative of future results.

Wednesday, February 2, 2011

2008 Moon Chart to Forecast the Stock Market...S&P500


Kept experimenting to see if there is any correlation between the S&P500 and Lunar events...
Came up with this chart...Will see if this relationship continues in other years...If it does other charts will be posted as well...
 "History does not repeat itself, but it does rhyme." - Mark Twain

Tuesday, February 1, 2011

TNA...New Intraday Signal Today

A new signal today...are we getting whip sawed in a trading range or are we breaking out to the upside?
Trend Following signals will get us on the right side most of the time so we do not have to guess where the market is going, because, we know that the market is going to do whatever it wants to do whenever it wants to do it...
We keep our emotions out of our decision making process when using Trend Following signals...


Past performance is not indicative of future results.

Friday, January 28, 2011

Shooting Star on the S&P500 Weekly chart

On a Japanese Candlesticks weekly chart of the S&P500, we had a shooting star this week...
This a bearish reversal pattern...Look it up on StockCharts.com - ChartSchool - Introduction to Candlesticks...
In addition, the high of the S&P500 this week was higher than last weeks high and the close this week was below last weeks close...
This is "usually" a sign of distribution...and there "maybe" a lot of buying climaxes this week...
On Monday Investors Intelligence will report the buying and selling climaxes for this week...

Past performance is not indicative of future results.

TNA...New Intraday Signal Today


Past performance is not indicative of future results.

Wednesday, January 26, 2011

TNA...New Signal Today @ the Closing Bell


At the closing bell today (Jan 26th---> see chart above) we received a buy signal...
Of a total of 15 trades, 9 were winners and 6 were losses...
We will have losses, but we try to minimize them...

Past performance is not indicative of future results.

Tuesday, January 25, 2011

Long & Short Mutual Funds Ratio


This is updated from the December 11, 2010 posting...
This chart is from March 2009 to the present...It is the ratio of the market cap in long funds divided by the market cap in long funds plus the market cap in short funds...
Note that this ratio is currently higher than the level it was in April 2010 before the market corrected into July 2010...
This does not mean that the market has to correct now, it can advance from here, but, we should exercise some caution...Note that the market will always do what the market wants to do...It will always try to leave the station with the fewest number of people on board as possible...
We are still holding our short position from the Trend Following Signal of January 19,2011 and we will wait for a new signal before we reverse our position... 
 
Past performance is not indicative of future results.

Monday, January 24, 2011

Precious Metals....OB/OS Update


Updated from December 12,2010...
This chart starts at March 2009...
Turquoise = precious metals mutual fund...note that after investors sharp redemption's, a bottom in the price of gold formed (this chart does not have the price chart for gold...please compare this chart to a gold chart and match up the dates)...It is easier to spot bottoms than tops...
Again there were a lot of redemption's in this Precious Metals mutual fund...

Past performance is not indicative of future results.

Thursday, January 20, 2011

TNA...New Signal Today @ the Closing Bell


At the closing bell today (Jan 19th---> see chart above) we received a sell signal...
So from April 27,2010 through today the performance was 103% net of losses...
Of a total of 14 trades, 9 were winners and 5 were losses...
We will have losses, but we try to minimize them...

Past performance is not indicative of future results.

Tuesday, January 18, 2011

Stock Market Signals Update

Updated from January 2, 2011 post...

The last signal was a buy signal on December 1,2010...
We have not had another signal since then...
When we do get the next signal we will be posting it...
For those of you that are new to this blog, the signals are based on Trend Following...See the performance chart on the January 2,2011 post...
Note that the TNA today is about 78.62, intraday...The buy signal on Dec 1,2010, TNA was priced at 61.89...As of today that would have added about 27% to the performance for a total of 113% from April 27,2010 to today, net of losing trades...

Past performance is not indicative of future results.

Sunday, January 2, 2011

2011 New Strategy

This performance chart shows trades of the TNA based on the SPX signals...It has generated an 86% net gain for 8 months...If it was updated through Dec 31st instead of through Dec 1st, the net gain would have been 103% for 8 months...I am switching to these signals because it generated less trades than the previous strategy with 40 trades and it still generated healthy net gains...For 8 months there were 13 trades, 8 gains and 5 losses...
So...this strategies last signal was a buy on Dec 1st...We now are waiting for the next sell signal...

Past performance is not indicative of future results.

TNA new signal

New sell signal at the close on Friday Dec 31st...This signal ended 11 months of signals with a net gain of 122%...These signals will stop as of this last sell signal on Dec 31st...
Over a period of 11 months we had 40 trades, 23 gains and 17 losses...Another post will explain our new strategy for 2011...

Past performance is not indicative of future results.