Tuesday, July 26, 2016

Picasso Dates Updated

Courtesy of eSignal


The blue, red & black dots in the above Picasso chart corresponds with the blue, red & black arrows in the top chart of the daily SPY.   Note that the forecast top and bottom dates all held except for one.  On occasion a date can and will invert.  This is what happened on July 15th when the stock market displayed strong internal breath.  That is why other indicators MUST be used with cycle dates.  NEVER trade cycle dates without first confirming those dates with additional tools.

Keep following JustSignals using Twitter, @StockTwits or Follow By Email. 
Just submit your email address in the box on the Blog homepage
This has been posted for Educational Purposes Only.   Do your own work and consult with Professionals before making any investment decisions.  
Past performance is not indicative of future results

Monday, July 25, 2016

Earl & Earl2

By Danny / LunaticTrader.com

Markets kept up very well last week and stocks are still not in the mood for any pullback. That will obviously change some day, but when? I don't know how many under water shorts are still waiting for a decent chance to get out, but that could be one of the reasons why this market has refused to pull back since its new record highs.
Here is the current Nasdaq chart:
^COMP (Daily)  10_27_2014 - 7_22_2016
While the S&P 500 is at new highs the Nasdaq still has quite a few hurdles in front of it before it can do the same. The 5100-5200 area is heavy overhead resistance in this index.
The Earl index (blue line) has started pulling back from a major high, but the market is not coming along. Meanwhile a new lunar green period is starting, which normally favors further gains. But the lunar cycle hasn't worked well so far this year, so we better be careful. The slower Earl2 (orange line) is still headed higher, suggesting further gains in the pipeline.
I see a very mixed technical picture, so I am not going to commit too strongly either way at this point. The short term momentum is clearly up, but that can change very quickly. We will probably get more clarity soon.

Keep following JustSignals using Twitter, @StockTwits or Follow By Email. 
Just submit your email address in the box on the Blog homepage
This has been posted for Educational Purposes Only.   Do your own work and consult with Professionals before making any investment decisions.  
Past performance is not indicative of future results

Thursday, July 21, 2016

Where R We Now?

Courtesy of humblestudentofthemarkets.com

Courtesy of humblestudentofthemarkets.com

Courtesy of humblestudentofthemarkets.com
The above charts display the changing data in recent sentiment.  There is now data that supports/suggests that we may experience a short term market pullback or at least some kind of consolidation soon.

If and when there is a pullback, we would refer back to the post below on March 4,2016 titled 2016 Bull or Bear?.
Link    http://justsignals.blogspot.com/2016/03/2016-bear-or-bull.html

In that post the Escape Velocity is discussed.  Based on the data in that post, we should allow for a higher market in the second half of the year.


The July 6,2016 post, David Kostin of Goldman Sachs also suggests a sell-off could come in the next three months, Kostin expects some recovery in the market that would bring the S&P 5oo back up by the end of the year.

Link     http://justsignals.blogspot.com/2016/07/david-kostin-of-goldman-sachs.html

The ChaikinAnalytics charts posted on July 20,2016 also indicate a short term OB market.
Link     http://justsignals.blogspot.com/2016/07/charts-sly-iwm-qqq.html

So if a pullback develops we will look at the indicators at that time and if all looks according to plan, buy the dip.

Keep following JustSignals using Twitter, @StockTwits or Follow By Email. 
Just submit your email address in the box on the Blog homepage
This has been posted for Educational Purposes Only.   Do your own work and consult with Professionals before making any investment decisions.  
Past performance is not indicative of future results

Wednesday, July 20, 2016

Dow's 9 day winning streak


Interesting data !

But do not forget that August is the next potentially weak month.


Keep following JustSignals using Twitter, @StockTwits or Follow By Email. 
Just submit your email address in the box on the Blog homepage
This has been posted for Educational Purposes Only.   Do your own work and consult with Professionals before making any investment decisions.  
Past performance is not indicative of future results

charts: SLY IWM QQQ

Courtesy of ChaikinAnalytics.com
Each of the above charts share a common theme.  Higher highs in price, lower highs in the Chaikin Money Flow and Overbought. 
   
Keep following JustSignals using Twitter, @StockTwits or Follow By Email. 
Just submit your email address in the box on the Blog homepage
This has been posted for Educational Purposes Only.   Do your own work and consult with Professionals before making any investment decisions.  
Past performance is not indicative of future results

Tuesday, July 19, 2016

Earl & Earl2

By Danny / LunaticTrader.com

The S&P 500 has reached new record highs and has kept up surprisingly well all week. Will this market just keep climbing without looking back? Maybe.
The S&P 500 chart may offer us a few clues:
^SP500 (Daily)  10_15_2014 - 7_15_2016
There is no clear overhead resistance level at this point. But the Earl indicator (blue line) is turning down already and the MoM has reached very optimistic +8 level, which is quite rare. This suggests that we "should" get at least a bit of a pullback here.
When a market breaks out from a long sideways pattern it is classic to turn back and kiss the old support/resistance line before continuing in the direction of the breakout. In this case that would mean a drop back to ~2130. That's my current base scenario, given that we remain in a lunar red period. But of course we cannot rule out that the market may climb even further before taking a vacation.
This market is bullish until proven otherwise, and I wouldn't fight the trend. Let's see if we get that kiss.
Keep following JustSignals using Twitter, @StockTwits or Follow By Email. 
Just submit your email address in the box on the Blog homepage
This has been posted for Educational Purposes Only.   Do your own work and consult with Professionals before making any investment decisions.  
Past performance is not indicative of future results

Weekly Stock Picks Updated

Posted on  Monday, July 4, 2016

Something new, Weekly stock Picks will be made based on taking a long position while the stock is at or near an Over Sold level.  These stocks display good technical strength including Chaikin Money Flow & Relative Strength.
As always, do you own due diligence !
CORE                          7/5/16 @   46.77   today  48.06 GAIN
FDP                             7/5/16 @   54.07   today  56.01 GAIN
GGAL                          7/5/16 @   30.67    today 32.16 GAIN
HTH                             7/5/16 @   20.41    today 21.97 GAIN
YWO  typo s/b TWO    7/5/16 @    8.47     today   8.61 GAIN
WWW                           7/5/16 @  19.94    today 22.89 GAIN
AVX                              7/5/16 @  13.33    today 13.82 GAIN
BDC                             7/5/16 @  58.07     today 72.01 GAIN
JEC                              7/5/16 @  48.65     today 52.29 GAIN
X                                  7/5/16 @  17.64      today 20.79 GAIN

Each of the stocks above are now short term over bought and are NOT on the weekly pick list anymore.
Usually a basket of stocks has some losers in them but these all were winners.

More weekly stock picks may be done going forward. 

Keep following JustSignals using Twitter, @StockTwits or Follow By Email.  
Just submit your email address in the box on the Blog homepage

This has been posted for Educational Purposes Only.   Do your own work and consult with Professionals before making any investment decisions.  
Past performance is not indicative of future results

Tuesday, July 12, 2016

Fear & Greed Index


Courtesy of CNN/Money
The above indicator has moved even further into the Extreme Greed area. 

Keep following JustSignals using Twitter, @StockTwits or Follow By Email. 
Just submit your email address in the box on the Blog homepage
This has been posted for Educational Purposes Only.   Do your own work and consult with Professionals before making any investment decisions.  
Past performance is not indicative of future results

Monday, July 11, 2016

Earl & Earl2

By Danny / LunaticTrader.com

Markets kept climbing last week, and the S&P 500 came very close to new all time highs, which is what we called for. We may see a new S&P high today, even though a new lunar red period has started. But the LT wave for July projects highs on the 11th or the 26th, so let's see.
The Nasdaq is not so close to its all time high and here the question becomes if it can break out above the 5000 level and stay there. Here is the chart:
^COMP (Daily)  9_26_2014 - 7_8_2016
My 3 indicators are all pointing up and the Earl2 has painted a bullish divergence. So, the odds for a break above 5000 and a further climb look pretty good. But it may not come without some hesitation. So, I think we will see a new high for S&P 500, but then probably a bit of a pullback for the next 10 days. If that pullback is mild then the market will be well positioned to climb further in August.

Keep following JustSignals using Twitter, @StockTwits or Follow By Email. 
Just submit your email address in the box on the Blog homepage
This has been posted for Educational Purposes Only.   Do your own work and consult with Professionals before making any investment decisions.  
Past performance is not indicative of future results

Friday, July 8, 2016

chart: % of DJIA stocks above 10 DMA

Courtesy of IndexIndicators.com

Keep following JustSignals using Twitter, @StockTwits or Follow By Email. 
Just submit your email address in the box on the Blog homepage
This has been posted for Educational Purposes Only.   Do your own work and consult with Professionals before making any investment decisions.  
Past performance is not indicative of future results

charts: Fear & Greed Index

Courtesy of CNN/Money
 
Keep following JustSignals using Twitter, @StockTwits or Follow By Email. 
Just submit your email address in the box on the Blog homepage
This has been posted for Educational Purposes Only.   Do your own work and consult with Professionals before making any investment decisions.  
Past performance is not indicative of future results

SPY 4min chart

Courtesy of TradeStation
Red = sell signal & green = buy signals.  They have been working fairly well lately.

Keep following JustSignals using Twitter, @StockTwits or Follow By Email. 
Just submit your email address in the box on the Blog homepage
This has been posted for Educational Purposes Only.   Do your own work and consult with Professionals before making any investment decisions.  
Past performance is not indicative of future results

Thursday, July 7, 2016

Bond Yields

July 07, 2016

The 60-year cycle in interest rates has been operating for as long as interest rate data have reliably been collected.  And right now it is saying that we should be in an upward trend for interest rates, lasting until 2040.  So the negative interest rate policy (NIRP) being foisted upon us by the smart people who run the world’s central banks is running contrary to that cycle, and thus is storing up problems for the future.  Delaying the inevitable just makes the inevitable that much more painful once it gets here. 
The bottom of this current interest rate cycle is now going on being 6 years overdue, but that is not unusual.  Past cycle lows have seen rather broad patterns in yields before starting the upward phase. 
A cycle bottom had been due in 1890, and it appeared to have come in back in 1889, but then rates dropped even further into a low in 1900 before rising again toward the 1920 top.  And back in 1830 when another 60-year low was due, the actual low arrived 6 years prior in 1824, a low which was retested in 1830 which was on schedule.  So the point is that some significant variation is normal, and without disrupting the overall cycle. 
The Moody’s Aaa corporate bond yield used in this chart are available from https://fred.stlouisfed.org/series/AAA#.  The older data are a bit harder to come by, for those wanting to keep score at home. 
The 60-year cycle also shows up in other data series, and especially climate data.  See:
 
So because the 60-year cycle shows up in both interest rates and global temperature data, it is not surprising that climate data are related to interest rate data, as discussed here:
 
Evidently, the warming planet is creating a bit of an anomaly in the inflation and interest rate data.  Warmer global average temperatures seem to be helping to keep inflation rates at a very low level, thereby helping to keep interest rates also at a low level.  This shows up in the CPI inflation rate, as shown in this chart:

If the CPI inflation rate is to continue following the pattern of global average temperatures, as it has since the CPI was created back in 1913, then that means prices should see a big downturn over at least the next 3 years, based on the 3-year leading relationship shown in this chart. 
Whether the Fed, the ECB, the Bank of Japan, and other central banks will follow that message is the great mystery that remains to be seen.  But the message for us now is that while the 60-year cycle’s trend says interest rates should be going upward, the global average temperature data say that we are not yet done with the deflationary period for prices of “stuff”, and thus global interest rates are going to stay low for a while.
Tom McClellan
Editor, The McClellan Market Report
www.mcoscillator.com
(253) 581-4889 

Keep following JustSignals using Twitter, @StockTwits or Follow By Email. 
Just submit your email address in the box on the Blog homepage
This has been posted for Educational Purposes Only.   Do your own work and consult with Professionals before making any investment decisions.  
Past performance is not indicative of future results

Wednesday, July 6, 2016

Today's Setup Trades

Looking Over My Shoulder this is what you would see.

Courtesy or TradeStation
The green circle is where the OS area is and then wait for the histogram to turn up noted by the green arrow.
Always use stops in case you are wrong to help minimize losses.

The red circle is where the OB area is and then wait for the histogram to turn down noted by the red arrow.
Always use stops in case you are wrong to help minimize losses.

Keep following JustSignals using Twitter, @StockTwits or Follow By Email. 
Just submit your email address in the box on the Blog homepage
This has been posted for Educational Purposes Only.   Do your own work and consult with Professionals before making any investment decisions.  
Past performance is not indicative of future results

David Kostin of Goldman Sachs

Goldman: Get ready for another stock market dive

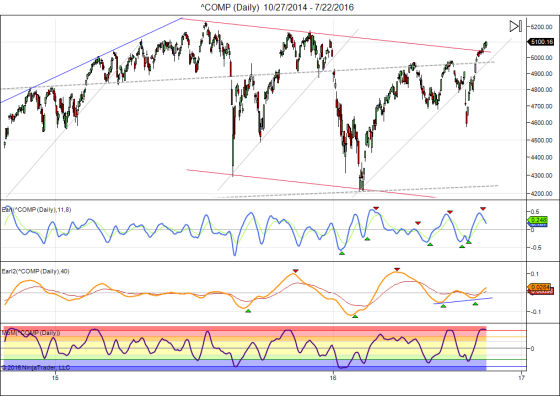
It's been a shaky year so far for the stock market. A huge drop to start the year was followed by a monumental comeback, and now the market appears to have settled into a relatively stable, albeit uninspiring range.
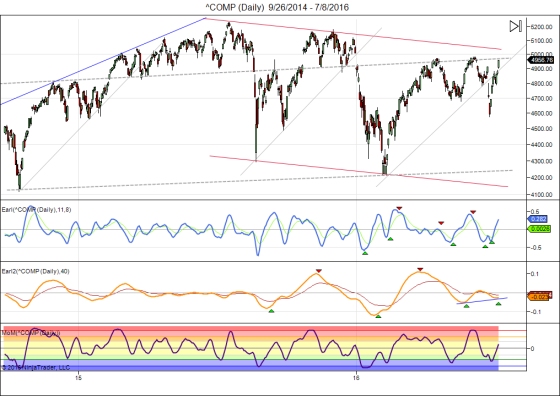
A market sell-off between 5% and 10% should be coming soon, according to Goldman Sachs US Equity Strategist David Kostin. A mix of factors currently building up in the market, along with the market's recent history of pullbacks, should end with a drop in the next three months.

"Although investors appear complacent in the wake of Brexit, a maturing economic cycle with elevated valuations, decelerating buybacks, and growing political uncertainty provide the basis for potential market weakness in the second half," Kostin wrote.
There's a lot to break down there, but here's a quick refresher of Kostin's concerns:
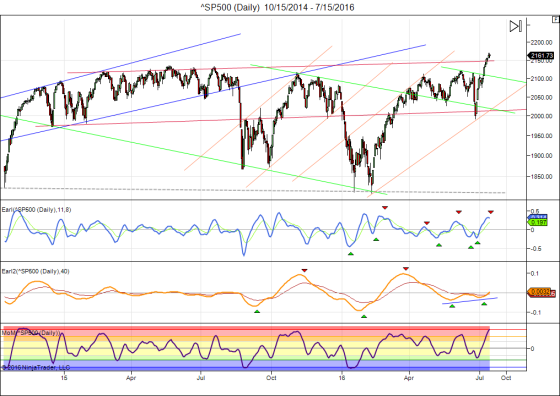
  • Valuations for stocks are well above their long-run averages, making them expensive. The 12-month forward price-to-earnings of the S&P 500 is 16.4x, whereas the average over the past 10 years is 14.3x. This increased valuation even drew the attention of the Federal Reserve.
  • Buybacks have been a massive source of support for stocks — in fact, the only net source of demand. For instance, Bank of America Merrill Lynch said its corporate clients have bought back $20.6 million in stock on net, while retail investors, hedge funds, and institutional investors have sold a combined $38.1 million stocks on net. Tightening credit conditions and decreasing cash flows may dry up this source of support.
  • Everyone is not only worried about Brexit, but also myriad political possibilities that are sowing the seeds of market uncertainty.
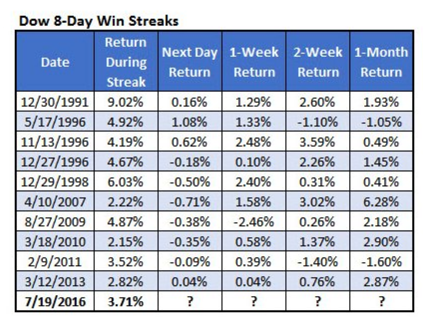
In addition to current trends, Kostin pointed to the historical falls in the stock market since the end of the financial crisis. Even in the past 12 months there have been significant drawdowns, in both August 2015 and the start of 2016. This pattern lead Kostin to gauge the severity of the drop.
"Most recent drawdowns have troughed at a forward P/E of roughly 15x," Kostin wrote.
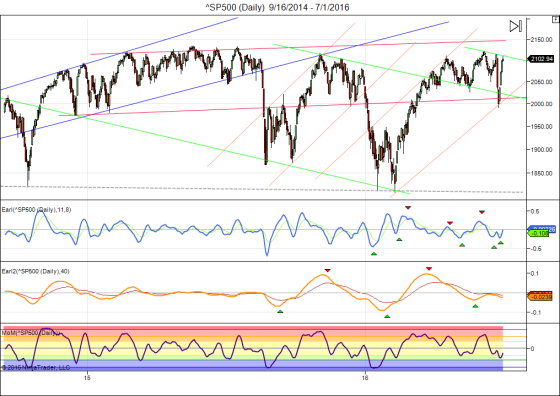
"Given consensus bottom-up next-12-month EPS of $123, this same multiple would value the S&P 500 at roughly 1850, or 13% below its recent high of 2115 reached in early June. In 16 S&P 500 pullbacks of 5% or more since 2009, the S&P 500 has declined by a median of 7%, which would bring the S&P 500 to roughly 1950."


However, there is some good news here, Kostin said. While the sell-off would come in the next three months, Kostin expects some recovery in the market that would bring the S&P 5oo back to 2,100 by the end of the year. As of the market open on Wednesday, the index was trading at roughly 2,084.
There are a few reasons to expect the support, according to the Goldman strategist.
"At the same time, above-trend US economic growth, a return to positive but slow earnings growth, a cautious Fed, and the lack of investment alternatives around the globe will support equity prices without providing a catalyst for further upside," Kostin wrote.
So get ready for the fall, but also the bounce back.

Keep following JustSignals using Twitter, @StockTwits or Follow By Email. 
Just submit your email address in the box on the Blog homepage
This has been posted for Educational Purposes Only.   Do your own work and consult with Professionals before making any investment decisions.  
Past performance is not indicative of future results

Tuesday, July 5, 2016

What's Next? One Opinion

By Danny/LunaticTrader

Most stock markets surged higher after the Brexit panic subsided. If you bought when others were fearful, as we suggested last week, then you must be smiling. The FTSE 100 climbed about 10% from its Monday lows and is already setting new highs for the year. US markets also rebounded strongly.
Is it now too late to buy? Let's have a look at the S&P 500:
^SP500 (Daily)  9_16_2014 - 7_1_2016
We got the retest of the 2000 level I had been hoping for. And stocks bounced back very strongly off that level. That is bullish price action, but another revisit of the 2000 level would now quickly worsen the scenario. Being not far from new all time highs the market can be allowed some breathing space at this point, but not for too long. A continued failure to climb above the May 2015 highs would soon be punished with another sell-off. So, the market is entering a do-or-die situation.
Technically the setup is favorable with the Earl (orange line) and MoM indicators turning up again, and the slower Earl2 (blue line) at the verge of doing so. So a push to new highs is possible this week already and if it doesn't happen then another chance may come by early August.
If no new highs are seen before the middle of August then the odds will quickly shift towards another drop to ~1900. But I prefer to take things one step at a time, so let's first see what happens with the current market rally.
We also have the LT wave chart for July:
ltwaveJuly2016
The wave did well in June. The high of the month came exactly on the 8th and a first low came on the 16th, just one day off with projected low on the 17th. The second low (expected on 23rd) came with a few days of delay, and was followed by new strength in the final days, as expected.
For July the wave suggests ongoing strength until the 11th, followed by weakness from the 13th until around 20th. The final week looks mildly positive again. Highest LT wave values come on the 6th and the 11th, with another possible peak on 26th. LT wave lows are projected for 16th and 20th. None of those highs and lows stand out as extreme values so it could turn out to be a sideways range period, especially from the 13th onwards.
Keep following JustSignals using Twitter, @StockTwits or Follow By Email. 
Just submit your email address in the box on the Blog homepage
This has been posted for Educational Purposes Only.   Do your own work and consult with Professionals before making any investment decisions.  
Past performance is not indicative of future results

Monday, July 4, 2016

This Weeks Stock Picks

Something new, Weekly stock Picks will be made based on taking a long position while the stock is at or near an Over Sold level.  These stocks display good technical strength including Chaikin Money Flow & Relative Strength.
As always, do you own due diligence !
CORE
FDP
GGAL
HTH
YWO  typo s/b TWO
WWW
AVX
BDC
JEC
X

Keep following JustSignals using Twitter, @StockTwits or Follow By Email.  
Just submit your email address in the box on the Blog homepage
This has been posted for Educational Purposes Only.   Do your own work and consult with Professionals before making any investment decisions.  
Past performance is not indicative of future results