Most stock markets surged higher after the Brexit panic subsided. If you bought when others were fearful,
as we suggested last week, then you must be smiling. The FTSE 100
climbed about 10% from its Monday lows and is already setting new highs
for the year. US markets also rebounded strongly.
Is it now too late to buy? Let's have a look at the S&P 500:
Is it now too late to buy? Let's have a look at the S&P 500:
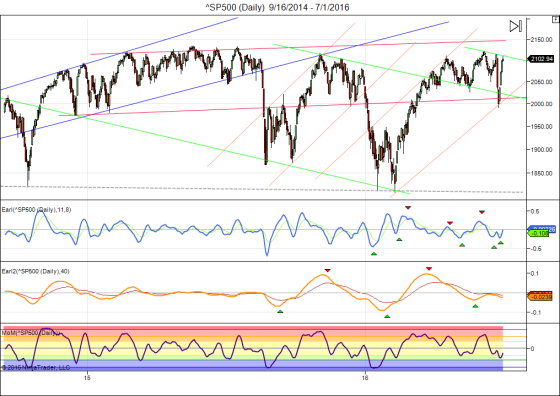
We
got the retest of the 2000 level I had been hoping for. And stocks
bounced back very strongly off that level. That is bullish price action,
but another revisit of the 2000 level would now quickly worsen the
scenario. Being not far from new all time highs the market can be
allowed some breathing space at this point, but not for too long. A
continued failure to climb above the May 2015 highs would soon be
punished with another sell-off. So, the market is entering a do-or-die
situation.
Technically
the setup is favorable with the Earl (orange line) and MoM indicators
turning up again, and the slower Earl2 (blue line) at the verge of doing
so. So a push to new highs is possible this week already and if it
doesn't happen then another chance may come by early August.
If no new highs are seen before the middle of August then the odds will quickly shift towards another drop to ~1900. But I prefer to take things one step at a time, so let's first see what happens with the current market rally.
If no new highs are seen before the middle of August then the odds will quickly shift towards another drop to ~1900. But I prefer to take things one step at a time, so let's first see what happens with the current market rally.
We also have the LT wave chart for July:
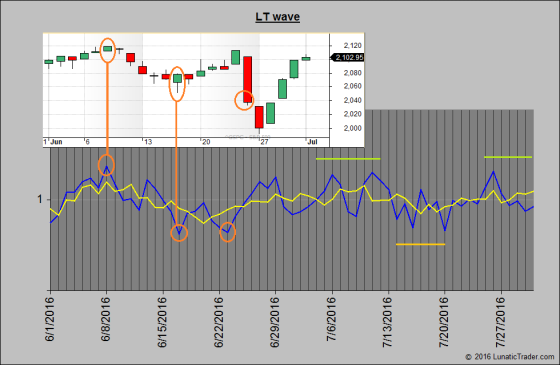
The wave did well in June.
The high of the month came exactly on the 8th and a first low came on
the 16th, just one day off with projected low on the 17th. The second
low (expected on 23rd) came with a few days of delay, and was followed
by new strength in the final days, as expected.
For July the wave suggests ongoing strength until the 11th, followed by weakness from the 13th until around 20th. The final week looks mildly positive again. Highest LT wave values come on the 6th and the 11th, with another possible peak on 26th. LT wave lows are projected for 16th and 20th. None of those highs and lows stand out as extreme values so it could turn out to be a sideways range period, especially from the 13th onwards.
For July the wave suggests ongoing strength until the 11th, followed by weakness from the 13th until around 20th. The final week looks mildly positive again. Highest LT wave values come on the 6th and the 11th, with another possible peak on 26th. LT wave lows are projected for 16th and 20th. None of those highs and lows stand out as extreme values so it could turn out to be a sideways range period, especially from the 13th onwards.
Keep following JustSignals using Twitter, @StockTwits or Follow By Email.
Just submit your email address in the box on the Blog homepage
This has been posted for Educational Purposes Only. Do your own work and consult with Professionals before making any investment decisions.
Past performance is not indicative of future results
Just submit your email address in the box on the Blog homepage
This has been posted for Educational Purposes Only. Do your own work and consult with Professionals before making any investment decisions.
Past performance is not indicative of future results
No comments:
Post a Comment
Note: Only a member of this blog may post a comment.