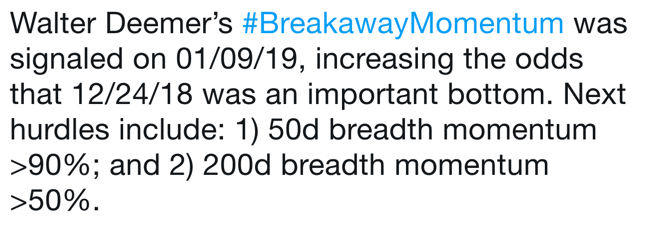
BUT, we are now at the first yellow vertical bar. This is where the first real, but shallow, corrections occurred in 2003,2009 & 2016. It should be watched carefully as our Picasso Composite Cycle (PCC) date is almost here. In the last PCC update posted on 3/4/2019 stated, the PCC date suggests a high in late March. We are now in the beginning of that window. So charts should be watched to see if indicators are breaking down and or showing any negative divergence.
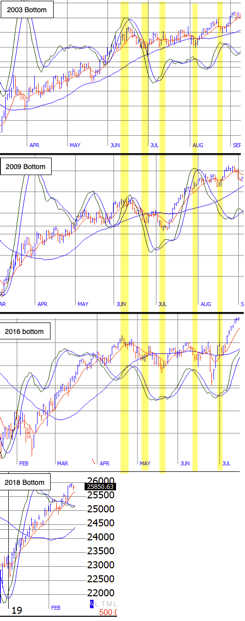
Above are the charts from the 2003 low, 2009 low & 2016 low. In each of these three lows there was a Breadth Thrust similar to the Breadth Thrust that we saw off of the Dec 2018 low. So these charts were interesting to review for any similarities. If any were found, then maybe we exposed some insight into how this rally may unfold as well.
There are 5 vertical yellow highlights. The first one shows where highs were noticed in each of the three years. It is interesting that they were all at about the three month mark! The second, third, fourth & fifth yellow highlights show where some small lows occurred after the high at the first yellow highlight.
In 2003 lows were made in and around the second, third & fourth yellow highlights before the market continued higher.
In 2009 lows were made in and around the second & third yellow highlights before the market continued higher.
In 2003 lows were made in and around the second, third, fourth and before the fifth yellow highlights before the market continued higher.
In summary, "if" history is any indication how the 2019 rally will play out, then we may expect a high around late March +/- and then a low to develop in the next 2-8 weeks before the market continues higher.
“History doesn't repeat itself but it often rhymes,” - Mark Twain
Keep following JustSignals using Twitter, @StockTwits or Follow By Email. Just submit your email address in the box on the Blog homepage.
This has been posted for Educational Purposes Only.
Do your own work and consult with Professionals before making any investment decisions.
Past performance is not indicative of future results.