The
S&P 500 has reached new record highs and has kept up surprisingly
well all week. Will this market just keep climbing without looking back?
Maybe.
The S&P 500 chart may offer us a few clues:
The S&P 500 chart may offer us a few clues:
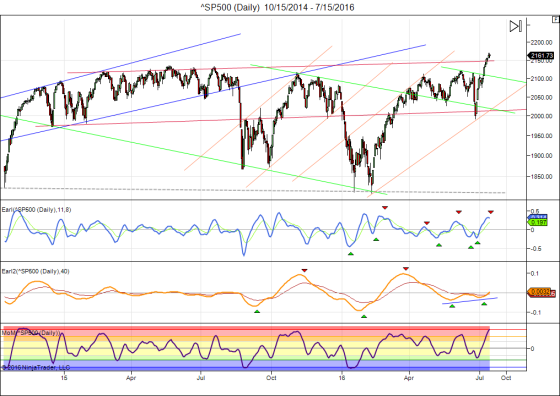
There
is no clear overhead resistance level at this point. But the Earl
indicator (blue line) is turning down already and the MoM has reached
very optimistic +8 level, which is quite rare. This suggests that we
"should" get at least a bit of a pullback here.
When a market breaks out from a long sideways pattern it is classic to turn back and kiss the old support/resistance line before continuing in the direction of the breakout. In this case that would mean a drop back to ~2130. That's my current base scenario, given that we remain in a lunar red period. But of course we cannot rule out that the market may climb even further before taking a vacation.
This market is bullish until proven otherwise, and I wouldn't fight the trend. Let's see if we get that kiss.
Keep following JustSignals using Twitter, @StockTwits or Follow By Email.
Just submit your email address in the box on the Blog homepage
This has been posted for Educational Purposes Only. Do your own work and consult with Professionals before making any investment decisions.
Past performance is not indicative of future results
Just submit your email address in the box on the Blog homepage
This has been posted for Educational Purposes Only. Do your own work and consult with Professionals before making any investment decisions.
Past performance is not indicative of future results
No comments:
Post a Comment
Note: Only a member of this blog may post a comment.