Markets
kept climbing last week, and the S&P 500 came very close to new all
time highs, which is what we called for. We may see a new S&P high
today, even though a new lunar red period has started. But the LT wave for July projects highs on the 11th or the 26th, so let's see.
The Nasdaq is not so close to its all time high and here the question becomes if it can break out above the 5000 level and stay there. Here is the chart:
The Nasdaq is not so close to its all time high and here the question becomes if it can break out above the 5000 level and stay there. Here is the chart:
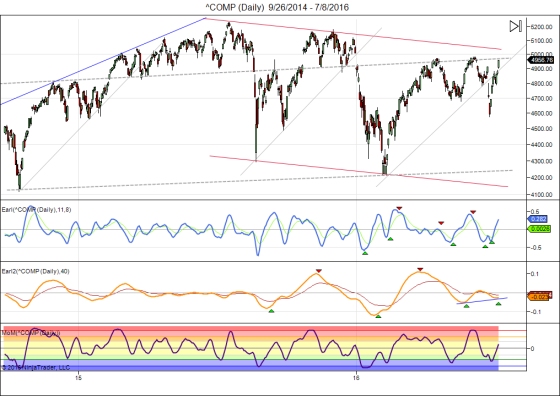
My
3 indicators are all pointing up and the Earl2 has painted a bullish
divergence. So, the odds for a break above 5000 and a further climb look
pretty good. But it may not come without some hesitation. So, I think
we will see a new high for S&P 500, but then probably a bit of a
pullback for the next 10 days. If that pullback is mild then the market
will be well positioned to climb further in August.
Keep following JustSignals using Twitter, @StockTwits or Follow By Email.
Just submit your email address in the box on the Blog homepage
This has been posted for Educational Purposes Only. Do your own work and consult with Professionals before making any investment decisions.
Past performance is not indicative of future results
This has been posted for Educational Purposes Only. Do your own work and consult with Professionals before making any investment decisions.
Past performance is not indicative of future results
No comments:
Post a Comment
Note: Only a member of this blog may post a comment.