Market Letter
August 16,
2016…………………………………………..
Hello!
The Dow, the
S&P 500, and the NASDAQs had been trading generally sideways for at least
two weeks in an overbought condition attended by extremely high bullish investor
sentiment. Then, as a child tests
his parent for days on end, the bulls continued to challenge and prod, leading
to several days of gap-up Opens which settled back into sideways moves for the
rest of the day. The situation was
akin to that of an inflating balloon, in which the observer knows what the
eventual outcome will be – the only question being When it will happen. It’s too soon to be certain; but it may
be that the balloon popped today.
In recent
weeks and moonths, the Russell 2000 and the S&P 600 SmallCaps had been
lagging the Dow, theS&P 500, and the NASDAQs; but recently they had caught
fire and had set new Highs of their own, which signaled a return to the Bull
party of the “man-in-the-street” investor.This phenomenon typically occurs at
the very end of a bull trend, and is characteristic thereof. It is a powerful warning that the party
is ending. It is also a signal that
the “little guy” is about to be burned, unless he is very careful and fleet of
action.
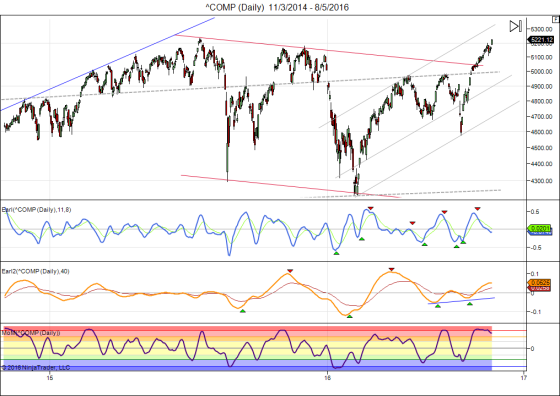
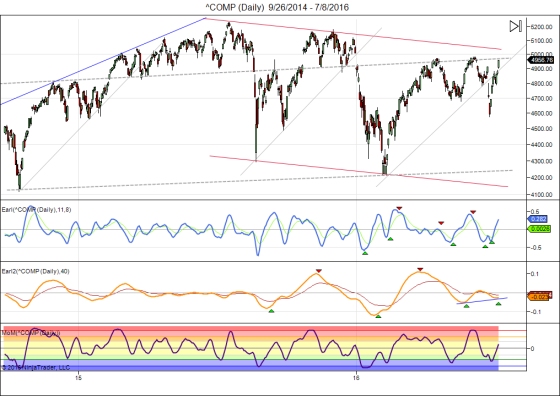
On the
60-minute chart of the NASDAQ Composite, please note the worry at the top, where
a series of small downmoves (together) bearishly engulfed the single spike-bar
to the top; and, especially, the Gap on the downswing which followed – and the
relatively strong Down Close.
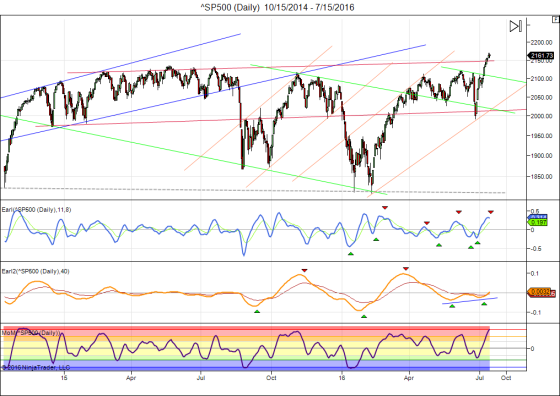
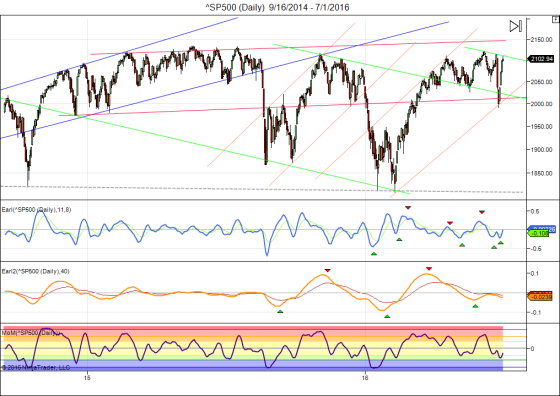
Please also
note the clearly bearish cast of the topping-and-reversing pattern shown on the
S&P 600 SmallCaps chart.
All of the
factors cited above are bits of evidence – not proof – that the tide may have
turned, to the downside. I think
that the odds favor a decline; and it could be substantial. My suggestion is toseriously consider
taking some of your chips off the
table.
Silver seems to be especially vulnerable to
a decline. We can see what appear
to be Exhauston Gaps on the way Up, and a large Rounded Top. The most powerful argument lies in the
Commitments of Traders chart, which shows that the Large Speulators (“hedge
funds”) are in a higher Net Long position than EVER. This situation cannot continue forever,
or for much longer. It is a recipe
for a massive implosion. The Silver
bulls have been testing, testing, testing the limit. The “little guy” is right in there too,
Net Long; and when the dike finally breaks there will be a mass rush for the
exits that will be a sight to beold; and not everyone will be able to escape
unscathed. I think that the “little
guy”should call it a day, pack it in, and get out now.
CandleWave, LLC
By William Kurtz,
President
906 Whippoorwill Dr., Palm Harbor FL 34683
USA
Wkurtz1@verizon.net
info@CandleWave.com
Keep following JustSignals using Twitter, @StockTwits or Follow By Email.
Just submit your email address in the box on the Blog homepage
This has been posted for Educational Purposes Only. Do your own work and consult with Professionals before making any investment decisions.
Past performance is not indicative of future results
Just submit your email address in the box on the Blog homepage
This has been posted for Educational Purposes Only. Do your own work and consult with Professionals before making any investment decisions.
Past performance is not indicative of future results