Last posted on December 15,2015
Updates in BLUE - RYNVX inched closer to an extreme reading
RYFXX - Rydex US Government Money Market
RYNVX - Rydex Nova Fund Investor Class (Long Fund)
RYURX - Rydex Inverse S&P 500® Strategy Fund Investor Class (Inverse Fund)
RYFXX 3-10-09 $1,367Mil 3-10-15 $655Mil 9-9-15 $1,434Mil
9-14-15 $1,451Mil
10-26-15 $862Mil
RYNVX 3-11-09 $21.96 Mil 5-14-15 $177Mil 9-4-15 $53Mil
9-14-15 $52Mil
10-26-15 $140Mil
11/27/15 $182Mil
12/10/15 $187Mil
12/29/15 $189Mil
1/15/16 $51Mil
RYURX 3-9-09 $353Mil 5-4-15 $58.34Mil 9-9-15 $148Mil
9-14-15 $172Mil
10-26-15 $117Mil
Note The RYNVX is now near another potential extreme. It is currently at $51Mil which is only $2Mil more than the $49Mil recorded on 9/29/15 on the retest of the 8/24-25/15 low.
*If this hint that a turn in the market is near turns out to be correct, we then understand why the Buying Pressure chart has been giving a positive divergence indication. Looking for a buildup of evidence.
This displays some fear in the market...
Keep following JustSignals using Twitter, @StockTwits or Follow By Email.
Just submit your email address in the box on the Blog homepage
This
has been posted for Educational Purposes Only. Do your own work and
consult with Professionals before making any investment decisions.
Past performance is not indicative of future results
Sunday, January 17, 2016

Friday, January 15, 2016
chart: SPY 4min Signals
 |
| Courtesy of TradeStation.com |
Green circles are buy signals. Two things must happen. You need a cross over in the bottom window or the histogram to be positive and you also need a price bar to close above the cyan MA and the purple MA to cross the cyan MA in the top window.
Red circles are sell signals. Two things must happen. You need a cross over in the bottom window or the histogram to be negative and you also need a price bar to close below the cyan MA and the purple MA to cross the cyan MA in the top window.
Of course it is wise to use additional tools for the best confirmations and do not forget to always use protective stops.
Keep following JustSignals using Twitter, @StockTwits or Follow By Email.
Just submit your email address in the box on the Blog homepage
This has been posted for Educational Purposes Only. Do your own work and consult with Professionals before making any investment decisions.
Past performance is not indicative of future results.
chart: Short Term Cycle Update
The following was posted on January 4,2016
Today's comments are in Blue
CORRECTION dated Jan 17,2016 in Red
Short term details:(every date is +/-)
Today's comments are in Blue
CORRECTION dated Jan 17,2016 in Red
Short term details:(every date is +/-)
From Dec 24th the cycles have an upward bias into December 29th to January 7-14 Dec
29th was another direct hit as a high did come on exactly that date.
There was a bias up into Dec 29 to Jan 7-14 and that is still the cycles
forecast. The traction that the market had into Dec 29th did not continue into Jan 7-14 as the cycles suggested. The market does not go either straight up or straight down
and therefore some counter trend moves do occur in these periods. The
big moves seen on the last days of 2015 and the big down open this
morning was much more volatile than the cycles suggested. Cycles do
suggest turning points and direction, but, they are not to be used for
amplitude. This was proven when the cycles chart below suggested a small drop and we actually had a large drop and it kept on going down. Other tools must always be used including the use of stops on all positions as part of your trading plan.
Below is a pic of the current cycles described above.
The Short Term Cycle dates have been
highlighted. On the way up into the Jan7-14 suggested highs, the
cycles did suggest a low on Jan 3rd which was Sunday. The cycles don't
know from weekends and Holidays so a carryover to the next day or a
"+/-" interpretation is always prudent. It is possible that today "MAY"
be a short term low.
The DJIA fell into Jan 4th which was one day after the Sunday Jan 3rd cycle date. The market then tried to rally, but, made a high on Jan 5th and then continued down into a low on Jan 11th. The DJIA then tried to rally and made a high on Jan 13th then again resumed it's fall. As this post is being written the DJIA Futures are down -150.00 points. If this holds continues on Friday Jan 15th, the possibility for another drop into the next cycle date of Jan 18th - 20th will increase.

Always use other indicators to CONFIRM the cycles suggested moves.
Intermediate Cycles suggest some sort
of correction in the first half of this year. Recent similar
intermediate cycles suggested corrections occurred during April 1992 -
Oct 1992 & Feb 2004 - Oct 2004. The new dates are from Jan/Feb 2016
- May/June/July 2016. This is still the forecast.
More on both the short term and intermediate term cycles as we get through some of these dates...
Keep following JustSignals using Twitter and @StockTwits
Or Follow By Email by submitting your email address in the box on the Blog homepage
This
has been posted for Educational Purposes Only. Do your own work and
consult with Professionals before making any investment decisions.
Past performance is not indicative of future results
Past performance is not indicative of future results
Wednesday, January 13, 2016
chart: Back to the Average Election Years
 |
| Courtesy of chartoftheday.com |
So far the YTD DJIA is down 6.7% into mid January. Sentiment is bearish, a contrarian indicator. Indicators/Oscillators are over sold and in buy areas. So what is going on? Why does the market keep going down?
One reason is momentum and the fact that bull markets last longer than bear markets so we experience bull markets for a longer period of time than we experience bear markets. At the beginning of a bull market there is momentum, a thrust, and as the bull gets under way the momentum starts to fade. Sometimes indicators/oscillators will generate sell signals, but, they will not even work and the bull just keeps going up.
That might just be what is happening now, in reverse. Maybe we are in a bear market?
The buying pressure has been showing positive divergence and the market keeps going down. What is probably happening is that the patten developing is not a short term pattern but a larger pattern that will take much more time to complete. If you take a close look at the buying presure chart you will see that this has happened before.
Short term cycles also have not been able to forecast turn dates and market direction recently as well as it had in the past. Dec 29th was the last cycle high that was forecast well. Then the short term cycle low of Jan 3rd was off by one day when the DJIA had a low on Jan 4th. But then, the market kept falling. Short term cycles are pointing down from Jan 13-14 into Jan 18-20, so let's see if the short term cycles get back on track again.
The intermediate cycles have been looking for a market correction in the first half of 2016. There is other information also suggesting a 2016 correction.
1) The pattern of the Average Election Years, see chart at the top of this page.
2) The 7th year of a two term President. 2015 was the first time since 1939 that the DJIA was down in the 7th year of a Presidency. The DJIA fell about 1/3 in 1940-1941. Note that 1940 was also an election tear.
3) The final year of a two term Presidency. In 5 of the last 6 times, the DJIA dropped and average of 13.9%.
4) No Santa rally this year. Yale Hirsch said, " If Santa Claus should fail to call, bears may come to Broad and Wall".
So back to the chart for a moment. The market does not go straight up or straight down. Even in the chart above there were several changes in trend. Be nimble and be careful. The market always tries to shake out as many investors/ and traders as possible. This is nothing new.
Keep following JustSignals using Twitter, @StockTwits or Follow By Email.
Just submit your email address in the box on the Blog homepage
This has been posted for Educational Purposes Only. Do your own work and consult with Professionals before making any investment decisions.
Past performance is not indicative of future results
chart: SPY 4min
 |
| Courtesy of TradeStation.com |
Green arrows bullish and red arrows bearish.
These signals are used along with the cross overs of MA's.
Keep following JustSignals using Twitter, @StockTwits or Follow By Email.
Just submit your email address in the box on the Blog homepage
This has been posted for Educational Purposes Only. Do your own work and consult with Professionals before making any investment decisions.
Past performance is not indicative of future results
Tuesday, January 12, 2016
chart: SPY Buying Pressure

Here we have again the SPY Buying Pressure. Only the bottoms were looked at in this chart. As we saw recently on Jan 7th, when the SPY Buying Pressure was last posted, the Buying Pressure showed positive divergence and it still does today. Since Jan 7th the Buying Pressure has not showed any sign weakness even though the SPY has been going lower.
There is no guarantee that the stock will rally from here, but, this chart does make some kind of rally seem promising.
Keep following JustSignals using Twitter, @StockTwits or Follow By Email.
Just submit your email address in the box on the Blog homepage
This has been posted for Educational Purposes Only. Do your own work and consult with Professionals before making any investment decisions.
Past performance is not indicative of future results
Monday, January 11, 2016
chart: Today's open on SPY 4min
 |
| Courtesy of TradeStation.com |
Keep following JustSignals using Twitter, @StockTwits or Follow By Email.
Just submit your email address in the box on the Blog homepage
This has been posted for Educational Purposes Only. Do your own work and consult with Professionals before making any investment decisions.
Past performance is not indicative of future results
Sunday, January 10, 2016
chart: DIA by Chaikin Analytics
 |
| Courtesy of ChaikinAnalytics.com |
Green circle - the sell off has not produced any significant red below zero in the CMF
Yellow circle - OBOS is in the OS area
White rectangle - RS is still green and above zero relative to SPY
Keep following JustSignals using Twitter, @StockTwits or Follow By Email.
Just submit your email address in the box on the Blog homepage
This has been posted for Educational Purposes Only. Do your own work and consult with Professionals before making any investment decisions.
Past performance is not indicative of future results
chart: Fear & Greed Index
 |
| Courtesy of CNN/money |
 |
| Courtesy of CNN/money |
Keep following JustSignals using Twitter, @StockTwits or Follow By Email.
Just submit your email address in the box on the Blog homepage
This has been posted for Educational Purposes Only. Do your own work and consult with Professionals before making any investment decisions.
Past performance is not indicative of future results
chart: %DJIA stocks above 10DMA
 |
| Courtesy of IndexIndicators.com |
Just submit your email address in the box on the Blog homepage
This has been posted for Educational Purposes Only. Do your own work and consult with Professionals before making any investment decisions.
Past performance is not indicative of future results
Friday, January 8, 2016
China's Stock Regulator Said...
The Wall Street Journal
China’s stock regulator to restrict major shareholders’ sales
New rules aimed at ‘stabilizing market expectations’
The China Securities Regulatory Commission has ruled that large shareholders -- those holding 5% or more of shares in listed companies -- won’t be allowed to sell more than 1% of total shares outstanding within the next three months, according to a statement on the regulator’s website.
The agency also ruled that large shareholders must disclose their share reduction plans to the exchanges 15 trading sessions in advance.
Keep following JustSignals using Twitter, @StockTwits or Follow By Email.
Just submit your email address in the box on the Blog homepage
This has been posted for Educational Purposes Only. Do your own work and consult with Professionals before making any investment decisions.
Past performance is not indicative of future results
Goldman Sachs Rethinks Outlook
Click on this link for the full article
read.bi/1PNtyu1
By BusinessInsider.com
Goldman Sachs is the latest firm to warn its clients that tumbling oil prices are bad news for stocks.
"We lower our S&P 500 [earnings per share] forecast by $3 to $106, $117, and $126 for 2015, 2016, and 2017, reflecting annual growth of -7%, +11% and +8%, respectively," Goldman Sachs' David Kostin said. "Energy is the leading driver of our reduced profit outlook."
Kostin follows Deutsche Bank's David Bianco and RBC Capital's Jonathan Golub in issuing this type of alert to clients.
"This seemed reasonable several weeks ago," Bianco said regarding his assumption that oil prices would average $55 a barrel in 2016. "But now it doesn't."
It's a remarkable turn of the tide when you consider that many of these forecasts were published just weeks ago. Kostin's was published November 23.
These warnings speak to the challenge of forecasting markets, especially the energy markets. Indeed, what's happening in the oil business has been unprecedented in at least the past five decades.
"We expect Energy will post a $2 per share loss in 2015 EPS, the first time that [last-twelve month] Energy EPS has been negative since our data series began in 1967," Kostin said. "The write-down in Energy company assets has exacerbated the earnings hit from the 35% fall in Brent crude oil prices in 2015 following a 48% plunge in the commodity price in 2014."
Kostin noted that the sector accounted for 12% of S&P EPS back in 2014.
Oil was trading near $40 a barrel a month ago when Wall Street's strategists were rolling out their 2016 stock market targets. Now, it's trading near the low $30s. And the S&P 500 has significant exposure to oil prices. The energy sector has been the primary source of weakness in stock prices and earnings.
On Wednesday, Oppenheimer's Fadel Gheit warned 2016 could be a worse year for energy stocks than 2015.
Kostin, meanwhile, maintains his 2016 year-end target of 2,100.
 FinVizWest Texas Intermediate oil prices.
read.bi/1PNtyu1
By BusinessInsider.com
Goldman Sachs rethinks its stock market outlook because of something that hasn't happened in at least 48 years
Just a few weeks ago, analysts were comfortable assuming that oil prices would finally stabilize and perhaps begin to recover in 2016. But that once reasonable assumption on Wall Street is turning into a disaster.Goldman Sachs is the latest firm to warn its clients that tumbling oil prices are bad news for stocks.
"We lower our S&P 500 [earnings per share] forecast by $3 to $106, $117, and $126 for 2015, 2016, and 2017, reflecting annual growth of -7%, +11% and +8%, respectively," Goldman Sachs' David Kostin said. "Energy is the leading driver of our reduced profit outlook."
Kostin follows Deutsche Bank's David Bianco and RBC Capital's Jonathan Golub in issuing this type of alert to clients.
"This seemed reasonable several weeks ago," Bianco said regarding his assumption that oil prices would average $55 a barrel in 2016. "But now it doesn't."
It's a remarkable turn of the tide when you consider that many of these forecasts were published just weeks ago. Kostin's was published November 23.
These warnings speak to the challenge of forecasting markets, especially the energy markets. Indeed, what's happening in the oil business has been unprecedented in at least the past five decades.
"We expect Energy will post a $2 per share loss in 2015 EPS, the first time that [last-twelve month] Energy EPS has been negative since our data series began in 1967," Kostin said. "The write-down in Energy company assets has exacerbated the earnings hit from the 35% fall in Brent crude oil prices in 2015 following a 48% plunge in the commodity price in 2014."
Kostin noted that the sector accounted for 12% of S&P EPS back in 2014.
Oil was trading near $40 a barrel a month ago when Wall Street's strategists were rolling out their 2016 stock market targets. Now, it's trading near the low $30s. And the S&P 500 has significant exposure to oil prices. The energy sector has been the primary source of weakness in stock prices and earnings.
On Wednesday, Oppenheimer's Fadel Gheit warned 2016 could be a worse year for energy stocks than 2015.
Kostin, meanwhile, maintains his 2016 year-end target of 2,100.
FinVizWest Texas Intermediate oil prices.Thursday, January 7, 2016
chart: SPY Buying Pressure

Orange = peaks in the Buying Pressure
Green = trough in the Buying Pressure
Yellow = positive divergence in the Buying Pressure
Blue = Probable bias up in the SPY as suggested by the Buying Pressure
Keep following JustSignals using Twitter, @StockTwits or Follow By Email.
Just submit your email address in the box on the Blog homepage
This has been posted for Educational Purposes Only. Do your own work and consult with Professionals before making any investment decisions.
Past performance is not indicative of future results
chart: Volume Oscillator

Above is the S&P500 and the Volume Oscillator (VO). The VO is currently oversold and in a buy area as noted by the green horizontal line. Use other indicators always as a confirmation.
This VO was an indicator used by the late Terry Laundry, may he RIP. He attended MIT and graduated as an engineer, but pursued a successful career in the analysis of financial markets and also managed client accounts. Much of his time was spent in researching the time symmetry in financial markets. Terry had named his work "T-Theory".
Keep following JustSignals using Twitter, @StockTwits or Follow By Email.
Just submit your email address in the box on the Blog homepage
This has been posted for Educational Purposes Only. Do your own work and consult with Professionals before making any investment decisions.
Past performance is not indicative of future results
chart: Worst Calendar Year Starts
 |
| Courtesy of @MktOutperform |
Keep following JustSignals using Twitter, @StockTwits or Follow By Email.
Just submit your email address in the box on the Blog homepage
This has been posted for Educational Purposes Only. Do your own work and consult with Professionals before making any investment decisions.
Past performance is not indicative of future results
chart: Today's Open
 |
| Courtesy of TradeStaion |
It would not surprise me to see a counter trend rally develop at sometime and into the short term cycle dates of Jan 11-15. More on the cycle dates soon.
Keep following JustSignals using Twitter, @StockTwits or Follow By Email.
Just submit your email address in the box on the Blog homepage
This has been posted for Educational Purposes Only. Do your own work and consult with Professionals before making any investment decisions.
Past performance is not indicative of future results
Wednesday, January 6, 2016
Santa's Message !
See this link for the full article
http://www.cbc.ca/news/business/santa-claus-rally-1.3389411
January 5,2016
By Daniel Schwartz, CBC News
1) Seventh Year of a Two Term Presidency
Jeffrey Hirsch, editor of the Stock Trader's Almanac, notes that 2015 was the first time since 1939, the year the Second World War started, that the Dow Jones industrial average was down in the seventh year of a presidency. Over 1940 and 1941, the Dow fell by about one-third.
2) Final Year of a Two-Term Presidency
Hirsch also points out that in years like 2016 (the final year of a two-term presidency), the Dow averages a drop of 13.9 per cent, and the index has been down in these cases five of the last six times.
3) No Santa Claus Rally (Dec 23rd to Jan 5th = S&P500 down -47.58)
There's been lots of talk in the business press in recent days about the Santa Claus rally. Definitions vary, but since the term was coined by the founder of the Stock Trader's Almanac, Yale Hirsch (Jeffrey's father), we'll use his benchmark. It looks at the overall performance of the last five trading days of a year, plus the first two trading days in the new year.
This year's result will be known when markets close today, but it's not looking like a rally.
For a rally to materialize, the S&P 500 needs to surpass its Dec. 23 close of 2,064.29. The index's closing price on Monday was almost 52 points away, 2,012.66. On only one day in the last four years has the index risen more than 52 points.
Jeffrey Hirsch told CBC News the seven-day trading stretch is usually
positive for stock markets because tax-loss selling has ended for the
year, funds are busy with year-end padding of portfolios and the people
still trading stocks during those days are "mostly professionals buying
beaten-down stocks, so when you don't have that rally there, it's an
indication that the pros are not really enamoured with the outlook for
the market, and that's a negative indicator for the future."
His father coined the legendary saying, "If Santa Claus should fail to call, bears may come to Broad and Wall." And the last four times the Santa Claus rally was negative, Jeffrey Hirsch points out, Wall Street's year would go on to be either flat or have a bear market.
Keep following JustSignals using Twitter, @StockTwits or Follow By Email.
Just submit your email address in the box on the Blog homepage
This has been posted for Educational Purposes Only. Do your own work and consult with Professionals before making any investment decisions.
Past performance is not indicative of future results
http://www.cbc.ca/news/business/santa-claus-rally-1.3389411
January 5,2016
By Daniel Schwartz, CBC News
1) Seventh Year of a Two Term Presidency
Jeffrey Hirsch, editor of the Stock Trader's Almanac, notes that 2015 was the first time since 1939, the year the Second World War started, that the Dow Jones industrial average was down in the seventh year of a presidency. Over 1940 and 1941, the Dow fell by about one-third.
2) Final Year of a Two-Term Presidency
Hirsch also points out that in years like 2016 (the final year of a two-term presidency), the Dow averages a drop of 13.9 per cent, and the index has been down in these cases five of the last six times.
3) No Santa Claus Rally (Dec 23rd to Jan 5th = S&P500 down -47.58)
There's been lots of talk in the business press in recent days about the Santa Claus rally. Definitions vary, but since the term was coined by the founder of the Stock Trader's Almanac, Yale Hirsch (Jeffrey's father), we'll use his benchmark. It looks at the overall performance of the last five trading days of a year, plus the first two trading days in the new year.
This year's result will be known when markets close today, but it's not looking like a rally.
For a rally to materialize, the S&P 500 needs to surpass its Dec. 23 close of 2,064.29. The index's closing price on Monday was almost 52 points away, 2,012.66. On only one day in the last four years has the index risen more than 52 points.
'If Santa Claus should fail to call, bears
may come to Broad and Wall.' That legendary Wall Street saying, coined
by Yale Hirsch, means that if there is no Santa Claus rally, the outlook
for U.S. stock markets becomes gloomy. (Seth Wenig/Associated Press)
His father coined the legendary saying, "If Santa Claus should fail to call, bears may come to Broad and Wall." And the last four times the Santa Claus rally was negative, Jeffrey Hirsch points out, Wall Street's year would go on to be either flat or have a bear market.
Keep following JustSignals using Twitter, @StockTwits or Follow By Email.
Just submit your email address in the box on the Blog homepage
This has been posted for Educational Purposes Only. Do your own work and consult with Professionals before making any investment decisions.
Past performance is not indicative of future results
Monday, January 4, 2016
charts: Worst Yearly Start Since 1932
Today, so far, is the worst start of a new year since 1932, -8.09%.
1922 also had a bad start being off -2.35% on the first day of trading.
BUT 1932 was also an Election Year and 1922 was not.
1922 was different. Jan 3,1922 came after a 46% correction from Nov 1919 to Aug 1921 which is very different than the market environment we are in today and have been in during the last couple of years.
Not that 1932 is similar to our current day market environment, but, the similarity is that 1932 was an Election Year just as 2016 is.
Below is a comparison of the 1932 price chart and the chart of Average Election Years since 1900.
After bad first day in 1932 the market held up in a trading range until it finally broke down in April and continued into a July low.
What is very interesting is that the chart of the Average Election Years above shows a very similar price pattern.
"History doesn't repeat itself, but it rhymes" - Mark Twain
So if the above gives us any hints to the price pattern for 2016, look for a high in the 1Q2016 and a low mid year +/-.
Looking at longer term repetitive cycles for additional guidance.
The following are dates of very similar cycles.
April/May1992 high Oct 1992 low DJIA lost -8%
Jan/Feb 2004 high Oct 2004 low DJIA lost -9%
Forecast:
Jan/Feb/March 2016 high June/July 2016 low +/- = ?
This is interesting because it suggests a similar price pattern as the Average Election Year chart.
Now that we addressed the first half of the year, what about the second half ?
The second half will be discussed at a latter time.
Keep following JustSignals using Twitter, @StockTwits or Follow By Email.
Just submit your email address in the box on the Blog homepage
This has been posted for Educational Purposes Only. Do your own work and consult with Professionals before making any investment decisions.
Past performance is not indicative of future results
1922 also had a bad start being off -2.35% on the first day of trading.
BUT 1932 was also an Election Year and 1922 was not.
1922 was different. Jan 3,1922 came after a 46% correction from Nov 1919 to Aug 1921 which is very different than the market environment we are in today and have been in during the last couple of years.
Not that 1932 is similar to our current day market environment, but, the similarity is that 1932 was an Election Year just as 2016 is.
Below is a comparison of the 1932 price chart and the chart of Average Election Years since 1900.
 |
| Courtesy of chartoftheday.com |
 |
| Courtesy of Worden Bros. |
What is very interesting is that the chart of the Average Election Years above shows a very similar price pattern.
"History doesn't repeat itself, but it rhymes" - Mark Twain
So if the above gives us any hints to the price pattern for 2016, look for a high in the 1Q2016 and a low mid year +/-.
Looking at longer term repetitive cycles for additional guidance.
The following are dates of very similar cycles.
April/May1992 high Oct 1992 low DJIA lost -8%
Jan/Feb 2004 high Oct 2004 low DJIA lost -9%
Forecast:
Jan/Feb/March 2016 high June/July 2016 low +/- = ?
This is interesting because it suggests a similar price pattern as the Average Election Year chart.
Now that we addressed the first half of the year, what about the second half ?
The second half will be discussed at a latter time.
Keep following JustSignals using Twitter, @StockTwits or Follow By Email.
Just submit your email address in the box on the Blog homepage
This has been posted for Educational Purposes Only. Do your own work and consult with Professionals before making any investment decisions.
Past performance is not indicative of future results
Short Term Cycles Update
The following was posted on December 23,2015
Today's comments are in Blue
Short term details:(every date is +/-)
Today's comments are in Blue
Short term details:(every date is +/-)
Dec 16-19 could be a high and Dec 24th a low as suggested by the short
term cycles. This was a direct hit as the
high did come in on Dec 17th in the middle of the forecast range of Dec
16-19. So far, the Dec 24th +/- low was a little late as the market
did bottom on Monday Dec 21st. But if you follow this Blog you would
have read that there was a shift in the SPY Buying Pressure and that
indicator called the market turn.

These dates are always +/-
From Dec 24th the cycles have an upward bias into December 29th to January 7-14 Dec 29th was another direct hit as a high did come on exactly that date. There was a bias up into Dec 29 to Jan 7-14 and that is still the cycles forecast. The market does not go either straight up or straight down and therefore some counter trend moves do occur in these periods. The big moves seen on the last days of 2015 and the big down open this morning was much more volatile than the cycles suggested. Cycles do suggest turning points and direction, but, they are not to be used for amplitude.
Here is a pic of the current cycles described above.
The Short Term Cycle dates have been highlighted. On the way up into the Jan7-14 suggested highs, the cycles did suggest a low on Jan 3rd which was Sunday. The cycles don't know from weekends and Holidays so a carryover to the next day or a "+/-" interpretation is always prudent. It is possible that today "MAY" be a short term low. Refer to the chart above for a potential future move in the market.
Always use other indicators to CONFIRM the cycles suggested moves.
Intermediate Cycles suggest some sort of correction in the first half of this year. Recent similar intermediate cycles suggested corrections occurred during April 1992 - Oct 1992 & Feb 2004 - Oct 2004. The new dates are from Jan/Feb 2016 - May/June/July 2016.
More on both the short term and intermediate term cycles as we get through some of these dates...
Keep following JustSignals using Twitter and @StockTwits
Or Follow By Email by submitting your email address in the box on the Blog homepage
This
has been posted for Educational Purposes Only. Do your own work and
consult with Professionals before making any investment decisions.
Past performance is not indicative of future results
Past performance is not indicative of future results
Sunday, January 3, 2016
2016 After a Flat Year
Stocks in 2016: why I like what I see (Danny's Opinion)
It looks like the S&P 500 will end the year very close to unchanged, which is quite rare. More on that below. The sideways range made it a challenging year for most investors. But our lunar cycles did exceptionally well: grabbing 833 points of profits for Nasdaq in lunar green periods, while sidestepping 555 points of losses in the red periods. See our lunar cycle tracking page. That’s as good as it gets in a flat market year. It will be difficult to do better in 2016, but of course we will try.
What about next year? I have noticed that a lot of major banks are calling for another flat year for stocks in 2016. Big banks rarely ever call for a bear market in their new year prognosis, so this is as bearish as they get. And other talking heads are joining the bearish bandwagon. IMF director Christine Lagarde is calling for disappointing global growth in 2016 and warns that the medium-term outlook is also deteriorating. So, we better sell our stocks before all hell breaks loose, right? Hmm, maybe…, but let’s think twice and first ask: when was the last time anybody made money by listening to Goldman Sachs or Mrs Lagarde?
Flat years in the stock market do not happen all that often. Defining a flat year as a year in which the S&P 500 index changes less than 5% from the previous yearly close I found only 11 such years since 1950. So, the odds that we will indeed get a flat 2016 is 1 in 6 or about 15%. Back to back flat years have not happened in at least 65 years. Maybe Goldman Sachs has fired all its quants, but the odds that they will be proven right in calling for another flat year do not look very good. Here is what has happened historically after flat years:
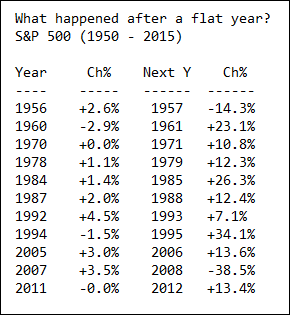
In all but one of those eleven cases a flat year was followed by a double digit % move in the ensuing year. Nine times the market went up and only two times it went down. In the nine up years the S&P 500 gained an average 17%, which is well above the long term average annual return of 7%.
I know, with only eleven cases the law of small numbers applies. But maybe the explanation is simple: a flat year makes investors lose interest in the stock market, setting the stage for a bigger move the next year if anything starts pulling them back in.
And that’s why I like what I see. With expectations rather subdued, if not pessimistic, the stage is set for a big move in 2016. I am looking for 2350 on the S&P and even that may be too pessimistic.
Keep following JustSignals using Twitter, @StockTwits or Follow By Email.
Just submit your email address in the box on the Blog homepage
This has been posted for Educational Purposes Only. Do your own work and consult with Professionals before making any investment decisions.
Past performance is not indicative of future results
Posted by Danny @LunaticTrader on December 31, 2015
It is the last trading day for 2015, a good opportunity for a little look at what has been and, more importantly, at what may be ahead…It looks like the S&P 500 will end the year very close to unchanged, which is quite rare. More on that below. The sideways range made it a challenging year for most investors. But our lunar cycles did exceptionally well: grabbing 833 points of profits for Nasdaq in lunar green periods, while sidestepping 555 points of losses in the red periods. See our lunar cycle tracking page. That’s as good as it gets in a flat market year. It will be difficult to do better in 2016, but of course we will try.
What about next year? I have noticed that a lot of major banks are calling for another flat year for stocks in 2016. Big banks rarely ever call for a bear market in their new year prognosis, so this is as bearish as they get. And other talking heads are joining the bearish bandwagon. IMF director Christine Lagarde is calling for disappointing global growth in 2016 and warns that the medium-term outlook is also deteriorating. So, we better sell our stocks before all hell breaks loose, right? Hmm, maybe…, but let’s think twice and first ask: when was the last time anybody made money by listening to Goldman Sachs or Mrs Lagarde?
Flat years in the stock market do not happen all that often. Defining a flat year as a year in which the S&P 500 index changes less than 5% from the previous yearly close I found only 11 such years since 1950. So, the odds that we will indeed get a flat 2016 is 1 in 6 or about 15%. Back to back flat years have not happened in at least 65 years. Maybe Goldman Sachs has fired all its quants, but the odds that they will be proven right in calling for another flat year do not look very good. Here is what has happened historically after flat years:

In all but one of those eleven cases a flat year was followed by a double digit % move in the ensuing year. Nine times the market went up and only two times it went down. In the nine up years the S&P 500 gained an average 17%, which is well above the long term average annual return of 7%.
I know, with only eleven cases the law of small numbers applies. But maybe the explanation is simple: a flat year makes investors lose interest in the stock market, setting the stage for a bigger move the next year if anything starts pulling them back in.
And that’s why I like what I see. With expectations rather subdued, if not pessimistic, the stage is set for a big move in 2016. I am looking for 2350 on the S&P and even that may be too pessimistic.
Keep following JustSignals using Twitter, @StockTwits or Follow By Email.
Just submit your email address in the box on the Blog homepage
This has been posted for Educational Purposes Only. Do your own work and consult with Professionals before making any investment decisions.
Past performance is not indicative of future results
Subscribe to:
Posts (Atom)