Posted by Danny @LunaticTrader on December 31, 2015
It is the last trading day for 2015, a good opportunity for a little look at what has been and, more importantly, at what may be ahead…It looks like the S&P 500 will end the year very close to unchanged, which is quite rare. More on that below. The sideways range made it a challenging year for most investors. But our lunar cycles did exceptionally well: grabbing 833 points of profits for Nasdaq in lunar green periods, while sidestepping 555 points of losses in the red periods. See our lunar cycle tracking page. That’s as good as it gets in a flat market year. It will be difficult to do better in 2016, but of course we will try.
What about next year? I have noticed that a lot of major banks are calling for another flat year for stocks in 2016. Big banks rarely ever call for a bear market in their new year prognosis, so this is as bearish as they get. And other talking heads are joining the bearish bandwagon. IMF director Christine Lagarde is calling for disappointing global growth in 2016 and warns that the medium-term outlook is also deteriorating. So, we better sell our stocks before all hell breaks loose, right? Hmm, maybe…, but let’s think twice and first ask: when was the last time anybody made money by listening to Goldman Sachs or Mrs Lagarde?
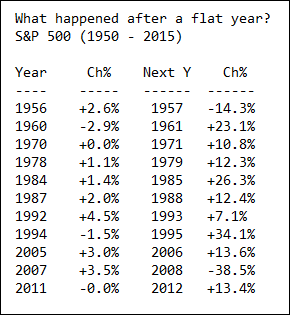
Flat years in the stock market do not happen all that often. Defining a flat year as a year in which the S&P 500 index changes less than 5% from the previous yearly close I found only 11 such years since 1950. So, the odds that we will indeed get a flat 2016 is 1 in 6 or about 15%. Back to back flat years have not happened in at least 65 years. Maybe Goldman Sachs has fired all its quants, but the odds that they will be proven right in calling for another flat year do not look very good. Here is what has happened historically after flat years:

In all but one of those eleven cases a flat year was followed by a double digit % move in the ensuing year. Nine times the market went up and only two times it went down. In the nine up years the S&P 500 gained an average 17%, which is well above the long term average annual return of 7%.
I know, with only eleven cases the law of small numbers applies. But maybe the explanation is simple: a flat year makes investors lose interest in the stock market, setting the stage for a bigger move the next year if anything starts pulling them back in.
And that’s why I like what I see. With expectations rather subdued, if not pessimistic, the stage is set for a big move in 2016. I am looking for 2350 on the S&P and even that may be too pessimistic.
Keep following JustSignals using Twitter, @StockTwits or Follow By Email.
Just submit your email address in the box on the Blog homepage
This has been posted for Educational Purposes Only. Do your own work and consult with Professionals before making any investment decisions.
Past performance is not indicative of future results
No comments:
Post a Comment
Note: Only a member of this blog may post a comment.