Tuesday, July 18, 2017

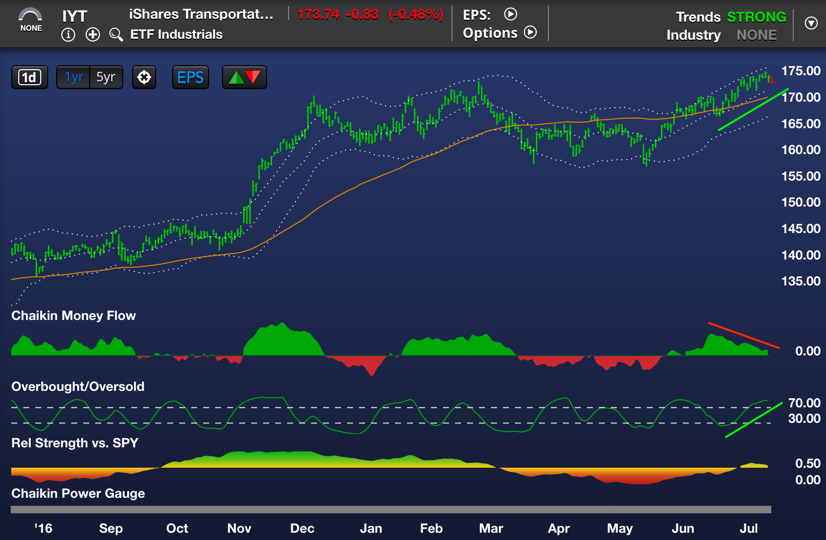
Charts: Correction Coming? Or the Pause that Refreshes?

Courtesy of ChaikinAnalytics.com

Courtesy of ChaikinAnalytics.com

Courtesy of ChaikinAnalytics.com

Courtesy of ChaikinAnalytics.com

Courtesy of ChaikinAnalytics.com

Courtesy of ChaikinAnalytics.com

Courtesy of ChaikinAnalytics.com

Lots of negative divergence.  Is a correction coming or is this the pause that refreshes?

Keep following JustSignals using Twitter, @StockTwits or Follow By Email. Just submit your email address in the box on the Blog homepage. This has been posted for Educational Purposes Only.   Do your own work and consult with Professionals before making any investment decisions.  Past performance is not indicative of future results


Friday, July 14, 2017

Picasso Cycle Update

In this update only the date/s will be mentioned with an "H" for high and a "L" for low.
The chart amplitude can and will be misleading at times.
In addition, it is the date/s that is most important rather than if that date is a projected high or low.
One important reason is because in some cases a date may invert and the "H" or "L" may not mean anything.
A low may actually turn out to be a high and visa versa.
Also it is very important that other tools always be used to confirm any potential ST Cycle Date. 

Picasso Dates, always +/- 
Mar 3-14 H - high occurred on Mar 15th
Mar 20-28 L - possible low occurring in this time frame - Low occurred on March 27th
Apr 10-13 H (+/-) - high occurred on April 5th & later on Apr 10th
Apr 4/21-24 L (+/-) - lows occurred on April 13th, 18th, 19th, 21st
Apr 28- May8 H - highs on April 26th & May 9th...only 3 day correction, then grinded higher
May 21 L  - actual low 2 TD's early on May18
May 25-June 1 H - June 1 hit a high then grinded marginally higher to June 9
June 10-19 L - actual low June 16
June 28-July3 H - June 26th high near this time frame - DJIA high, so far, July 3rd
July 7-14 L - low was July 11
July 19-28 H 
Aug 4-12 L

Comments
See new comments in blue above and below.

Long term indicators appear positive, so far.  Negative divergence on many indicators were broken very late last year and so they now suggest further upside.  So, if pullbacks develop into the Picasso cycle date lows and daily indicators are OverSold, it may present a good buying opportunity.
In addition, the LT cycles still suggest a high around April-June +/-, a low in August +/- & a high in November +/-.  Currently, highs have been made on June 19 & July 3rd.
Always remember to confirm cycle dates with your or your professional investment advisors analysis.

Keep following JustSignals using Twitter, @StockTwits or Follow By Email. Just submit your email address in the box on the Blog homepage. This has been posted for Educational Purposes Only.   Do your own work and consult with Professionals before making any investment decisions.  Past performance is not indicative of future results

Thursday, July 13, 2017

charts: SIgns of a ST low

Courtesy of @IndexIndicators.com

Courtesy of StockCharts.com
These two charts are confirming the Picasso Cycle Dates probable short term low during July 7th to July 14th.
See the July 9th post.

Keep following JustSignals using Twitter, @StockTwits or Follow By Email. Just submit your email address in the box on the Blog homepage. This has been posted for Educational Purposes Only.   Do your own work and consult with Professionals before making any investment decisions.  Past performance is not indicative of future results
Sunday, July 9, 2017

Picasso Cycle Update

In this update only the date/s will be mentioned with an "H" for high and a "L" for low.
The chart amplitude can and will be misleading at times.
In addition, it is the date/s that is most important rather than if that date is a projected high or low.
One important reason is because in some cases a date may invert and the "H" or "L" may not mean anything.
A low may actually turn out to be a high and visa versa.
Also it is very important that other tools always be used to confirm any potential ST Cycle Date. 

Picasso Dates, always +/- 
Mar 3-14 H - high occurred on Mar 15th
Mar 20-28 L - possible low occurring in this time frame - Low occurred on March 27th
Apr 10-13 H (+/-) - high occurred on April 5th & later on Apr 10th
Apr 4/21-24 L (+/-) - lows occurred on April 13th, 18th, 19th, 21st
Apr 28- May8 H - highs on April 26th & May 9th...only 3 day correction, then grinded higher
May 21 L  - actual low 2 TD's early on May18
May 25-June 1 H - June 1 hit a high then grinded marginally higher to June 9
June 10-19 L - actual low June 16
June 28-July3 H - June 26th high near this time frame - DJIA high, so far, July 3rd
July 7-14 L 
July 19-28 H

Comments
See new comments in blue above and below.

Long term indicators appear positive, so far.  Negative divergence on many indicators were broken very late last year and so they now suggest further upside.  So, if pullbacks develop into the Picasso cycle date lows and daily indicators are OverSold, it may present a good buying opportunity.
In addition, the LT cycles still suggest a high around April-June +/-, a low in August +/- & a high in November +/-.  Currently, highs have been made on June 19 & July 3rd.
Always remember to confirm cycle dates with your or your professional investment advisors analysis.

Keep following JustSignals using Twitter, @StockTwits or Follow By Email. Just submit your email address in the box on the Blog homepage. This has been posted for Educational Purposes Only.   Do your own work and consult with Professionals before making any investment decisions.  Past performance is not indicative of future results

charts: Equities vs Commodities

In the In the 9 yrs following the 1st green circle, gold rose from $42 to $800.  
In the 12 yrs following the 2nd, gold rose from $300 to $1900. 

Saturday, July 8, 2017

Equities Expensive and Commodities Cheap?

Incrementum AG (Jun 1, 2017) - In a historical context, the relative valuation of commodities to equities seems extremely low. In relation to the S&P500, the Goldman Sachs Commodity Index (GSCI) is currently trading at the lowest level in 50 years. 


The chart outlines the valuation of the GSCI relative to the S&P500. The GSCI comprises 24 commodities from all commodity sectors and serves as a benchmark for investment in the commodity markets and as a measure of commodity performance over time. If the ratio is low (green circles), it means that commodities are cheap relative to shares. If the ratio is at a high level (red circles), like during the Gulf Crisis in 1990, the prices of raw materials are relatively expensive.

The current ratio is 0.87 while the median is at 4.1. A return to the median gives 371% potential, but in most cases a rally doesn't stop at the median. In absolute terms, the scene seems set for a new bull market for commodities. According to Ned Davis Research, commodities gained 217% on average over the period of a bull market. 


Keep following JustSignals using Twitter, @StockTwits or Follow By Email. Just submit your email address in the box on the Blog homepage. This has been posted for Educational Purposes Only.   Do your own work and consult with Professionals before making any investment decisions.  Past performance is not indicative of future results

Monday, July 3, 2017

Picasso Cycle Update

In this update only the date/s will be mentioned with an "H" for high and a "L" for low.
The chart amplitude can and will be misleading at times.
In addition, it is the date/s that is most important rather than if that date is a projected high or low.
One important reason is because in some cases a date may invert and the "H" or "L" may not mean anything.
A low may actually turn out to be a high and visa versa.
Also it is very important that other tools always be used to confirm any potential ST Cycle Date. 

Picasso Dates, always +/- 
Mar 3-14 H - high occurred on Mar 15th
Mar 20-28 L - possible low occurring in this time frame - Low occurred on March 27th
Apr 10-13 H (+/-) - high occurred on April 5th & later on Apr 10th
Apr 4/21-24 L (+/-) - lows occurred on April 13th, 18th, 19th, 21st
Apr 28- May8 H - highs on April 26th & May 9th...only 3 day correction, then grinded higher
May 21 L  - actual low 2 TD's early on May18
May 25-June 1 H - June 1 hit a high then grinded marginally higher to June 9
June 10-19 L - actual low June 16
June 28-July3 H - June 26th high near this time frame
July 7-14 L

Comments
See new comments in blue above and below.

Long term indicators appear positive, so far.  Negative divergence on many indicators were broken very late last year and so they now suggest further upside.  So, if pullbacks develop into the Picasso cycle date lows and daily indicators are OverSold, it may present a good buying opportunity.
In addition, the LT cycles appear to have shifted.  The LT cycles now suggest a high around April-June +/-, a low in August +/- & a high in November +/-. 
Always remember to confirm cycle dates with your or your professional investment advisors analysis.

Keep following JustSignals using Twitter, @StockTwits or Follow By Email. Just submit your email address in the box on the Blog homepage. This has been posted for Educational Purposes Only.   Do your own work and consult with Professionals before making any investment decisions.  Past performance is not indicative of future results

July is historically a strong month


As per the chart above, July is one of the strong months of the year, historically.

Keep following JustSignals using Twitter, @StockTwits or Follow By Email. 
Just submit your email address in the box on the Blog homepage
This has been posted for Educational Purposes Only.   Do your own work and consult with Professionals before making any investment decisions.  
Past performance is not indicative of future results

Sector Performance

Courtesy of ChaikinAnalytics
Note that, as of Friday's close, 6/30/17,  only 3 sectors are stronger than the SPY and 7 sectors are weaker than the SPY.

Keep following JustSignals using Twitter, @StockTwits or Follow By Email. 
Just submit your email address in the box on the Blog homepage
This has been posted for Educational Purposes Only.   Do your own work and consult with Professionals before making any investment decisions.  
Past performance is not indicative of future results

Tuesday, June 27, 2017

chart: SPY daily signal

Courtesy of eSignal
Note tht the SPY daily chart is showing some weakness. 
Additional signals are still needed on this chart and on the weekly chart to confirm a change in trend from up to down.
The definition of a down trend is lower highs and lower lows and we do not have that yet.

Keep following JustSignals using Twitter, @StockTwits or Follow By Email. 
Just submit your email address in the box on the Blog homepage
This has been posted for Educational Purposes Only.   Do your own work and consult with Professionals before making any investment decisions.  
Past performance is not indicative of future results

Monday, June 26, 2017

chart: Stock/Bond Ratio


Stocks have done well this year and the past 90-days. Which would you rather have owned the past 90-days and Year to date, the S&P 500 or Bond fund ZROZ? Below looks at the performance of the S&P and ZROZ over the past 90-days.

Over the past 90-days, bond ETF ZROZ has nearly doubled the returns of the S&P 500. Despite the S&P doing well this year to date, ZROZ has done even better than the S&P 500, gaining around 3% more. Below looks at the Stock/Bond Ratio (SPX/ZROZ) over the past few years.

Courtesy of KimbleCharting
 Does it matter that bonds are stronger than stocks? Do bond traders know something that stock traders don’t?
Maybe it doesn’t matter until it matters applies to stock & bond performance of late! So far, the bond strength the past 90-days, doesn’t seem to matter to the stock market. If the stock/bond ratio would happen to keep heading south, in time I humbly feel it will matter and will send an important message, if it does.

Keep following JustSignals using Twitter, @StockTwits or Follow By Email. 
Just submit your email address in the box on the Blog homepage
This has been posted for Educational Purposes Only.   Do your own work and consult with Professionals before making any investment decisions.  
Past performance is not indicative of future results

Thursday, June 22, 2017

chart: SPY vs Hi-Lo 10DMA


The 10 Day Hi-Lo has created a triangle pattern.
When the SPY makes a higher high while the 10 day Hi-Lo starts to drop, be on watch.  In the past divergences appear at most turns in the market.  At the very least, the 10 day Hi-Lo develops lower highs and lower lows at or near tops and higher highs and higher lows at or near bottoms.  
But here we have a triangle pattern and right now there is no indication if it will break out of this pattern up or down.  But it is getting closer to the vertex.  So a break out should happen very soon.


Keep following JustSignals using Twitter, @StockTwits or Follow By Email. 
Just submit your email address in the box on the Blog homepage
This has been posted for Educational Purposes Only.   Do your own work and consult with Professionals before making any investment decisions.  
Past performance is not indicative of future results

SentimenTrader Finds...

Courtesy of @sentimentrader

Courtesy of @sentimentrader

Keep following JustSignals using Twitter, @StockTwits or Follow By Email. Just submit your email address in the box on the Blog homepage. This has been posted for Educational Purposes Only.   Do your own work and consult with Professionals before making any investment decisions.  Past performance is not indicative of future results


Monday, June 19, 2017

Picasso Cycle Updates

In this update only the date/s will be mentioned with an "H" for high and a "L" for low.
The chart amplitude can and will be misleading at times.
In addition, it is the date/s that is most important rather than if that date is a projected high or low.
One important reason is because in some cases a date may invert and the "H" or "L" may not mean anything.
A low may actually turn out to be a high and visa versa.
Also it is very important that other tools always be used to confirm any potential ST Cycle Date. 

Picasso Dates, always +/- 
Mar 3-14 H - high occurred on Mar 15th
Mar 20-28 L - possible low occurring in this time frame - Low occurred on March 27th
Apr 10-13 H (+/-) - high occurred on April 5th & later on Apr 10th
Apr 4/21-24 L (+/-) - lows occurred on April 13th, 18th, 19th, 21st
Apr 28- May8 H - highs on April 26th & May 9th...only 3 day correction, then grinded higher
May 21 L  - actual low 2 TD's early on May18
May 25-June 1 H - June 1 hit a high then grinded marginally higher to June 9
June 10-19 L - actual low June 16
June 28-July3 H

Comments
See new comments in blue above and below.

Long term indicators appear positive, so far.  Negative divergence on many indicators were broken very late last year and so they now suggest further upside.  So, if pullbacks develop into the Picasso cycle date lows and daily indicators are OverSold, it may present a good buying opportunity.
In addition, the LT cycles appear to have shifted.  The LT cycles now suggest a high around April-June +/-, a low in August +/- & a high in November +/-. 
Always remember to confirm cycle dates with your or your professional investment advisors analysis.

Keep following JustSignals using Twitter, @StockTwits or Follow By Email. Just submit your email address in the box on the Blog homepage. This has been posted for Educational Purposes Only.   Do your own work and consult with Professionals before making any investment decisions.  Past performance is not indicative of future results

Friday, June 16, 2017

chart: Buying Pressure vs SPY


The above chart shows each time the Buying Pressure was 17 or higher since January 2014.  The buying Pressure just hit 17 on June 15,2017.
If the market went higher it was a grind higher then it eventually dropped.  Otherwise the market went into a sideways trading range then down.

If this pattern continues it will coincide with the Long Term/Intermediate Picasso cycles suggesting a Summer pullback.   Let's keep an eye on it.

Keep following JustSignals using Twitter, @StockTwits or Follow By Email. 
Just submit your email address in the box on the Blog homepage
This has been posted for Educational Purposes Only.   Do your own work and consult with Professionals before making any investment decisions.  
Past performance is not indicative of future results

Wednesday, June 7, 2017

chart: SPY vs Buying Pressure

This chart is self explanatory.  
Just compare the red vertical lines at the peaks in the Buying Pressure to the SPY chart and see the subsequent movement in the SPY.
The red circle is where we are today.

Keep following JustSignals using Twitter, @StockTwits or Follow By Email. 
Just submit your email address in the box on the Blog homepage
This has been posted for Educational Purposes Only.   Do your own work and consult with Professionals before making any investment decisions.  
Past performance is not indicative of future results

Tuesday, June 6, 2017

charts: QQQ, DIA

Courtesy of ChaikinAnalytics.com
The above charts speak for themselves...

Keep following JustSignals using Twitter, @StockTwits or Follow By Email. 
Just submit your email address in the box on the Blog homepage
This has been posted for Educational Purposes Only.   Do your own work and consult with Professionals before making any investment decisions.  
Past performance is not indicative of future results


Thursday, June 1, 2017

chart:SPY vs Hi-Lo 10DMA


The 10 Day Hi-Lo has created a triangle pattern. 
When the SPY makes a higher high while the 10 day Hi-Lo starts to drop, be on watch.  In the past divergences appear at most turns in the market.  At the very least, the 10 day Hi-Lo develops lower highs and lower lows at or near tops and higher highs and higher lows at or near bottoms.  
But here we have a triangle pattern and right now there is no indication if it will break out of this pattern up or down.

Buying Pressure has been rising and is in or close to an area where highs have been made.

Keep following JustSignals using Twitter, @StockTwits or Follow By Email. 
Just submit your email address in the box on the Blog homepage
This has been posted for Educational Purposes Only.   Do your own work and consult with Professionals before making any investment decisions.  
Past performance is not indicative of future results

Wednesday, May 31, 2017

Paul Singer Warns......

By ZeroHedge.com

Paul Singer Warns "All Hell Will Break Loose"

by Tyler Durden  May 31, 2017 5:30 AM
 
It took Paul Singer's Elliott Management less than 24 hours to raise $5 billion earlier this month, however it is safe to say he won't be using any of that cash to buy stocks at current prices, or even BTFD. Instead, as he writes in his Q1 letter to investors, the legendary hedge fund manager thinks "that it is a good time to build a significant amount of dry powder,"
The reason for that is if, or rather when, Trump's pro-growth agenda fails to be implemented, "all hell will break loose" and that a recession looms as the artificial crutches propping up risk assets are pulled out:

Given group think and the determination of policy makers to do ‘whatever it takes’ to prevent the next market ‘crash,’ we think that the low-volatility levitation magic act of stocks and bonds will exist until the disenchanting moment when it does not. And then all hell will break loose (don’t ask us what hell looks like...), a lamentable scenario that will nevertheless present opportunities that are likely to be both extraordinary and ephemeral. The only way to take advantage of those opportunities is to have ready access to capital.

 Isolating the impact of the "Trump Put" as described recently by Deutsche Bank, Singer writes that "although the growth agenda of the Trump administration is slow to get off the ground, markets still anticipate that much of it will be enacted, sooner or later." And yet, according to most metrics, the Trump trade has already been priced out of most markets with the notable exception of equities, which as Bank of America pointed out in a note last week, are now the "last one standing".
Elliott's warning of a negative reaction in equity markets if Trump's economic policies are not delivered takes place as the US Congress debates how to fund proposed tax cuts for individuals and companies, and whether lawmakers are prepared to blow out the budget deficit as Trump's plan would. So far, all of Trump's various economic initiatives appear to have stalled permanently in Congress, with the market giving pricing in little possibility of their passage.

In this context, Singer warns that "there are actually forces in place that could point to a relatively near-term recession in the absence of solid new pro-growth policies." And with rates already at ultralow levels, the Federal Reserve won’t be able to provide a sufficient QE cushion, as it did during the great financial crisis. Which is why absent a procyclical push, the US economy may have no choice but to contract. Which is ironic because Singer, a prominent Republican donor, originally staunchly opposed Mr Trump as its candidate, before meeting the President at the White House in February where Trump claimed "he's given us his total support".
The manager of $32.6 billion in AUM once again points to his favorite nemesis, the Federal Reserve, and says that "we live in a time when extraordinary worldwide monetary policies have created bubble after bubble." Warning that QE has done nothing to address the fundamental issues of the economy, Singer said that rising sovereign and private debt loads will come back to haunt the markets and policy makers.
Expounding on a popular theme from his previous letters, Singer said that not only has the mess from the great financial crisis not been cleaned up, but all the wrong measures have been used to address the problem.
“Since the GFC, we have believed that the extreme monetary policy (ZIRP, NIRP, and QE) prevalent throughout the developed world was unsustainable and risky." He explains - as he has done every other quarter since 2008 - that the solution to a crisis resulting from financial engineering isn’t more financial engineering, but addressing the real issues that caused the problem to begin with. That has not beed one, and instead "the solution to overindebtedness should not have been the creation of more debt, and the problem of inadequate growth should not have been solved by money-printing and ZIRP/NIRP.
Singer also blames failed policies for the current breakdown between heightened geopolitical risk and record low volatility:
"On the face of it, year after year of the unusual and risky policy mix has not caused the collapse of any major currencies or significant inflation (other than in asset prices)," resulting in a world that has been put to sleep by pervasive complacency. "This seeming lack of empirical proof of the lurking danger has lulled most investors into thinking that the elevated prices of stocks and bonds, and the historical fall in price volatility in financial asset markets, is somehow a permanent condition."
To be sure, Singer has been one of the most outspoken market skeptics during the "central planning" phase of markets, issuing periodic warnings about China's debt-fueled boom and price bubbles in financial markets inflated by central banks' ZIRP/NIRP and bond buying policies of central banks. Maybe this time will be different.  Even so, Singer's stated skepticism hasn't prevented him from outperforming not only the S&P in recent peers, but the vast majority of his peers.
So what is Singer's advice for today's investors? In a time of historic market complacency, Singer believes that "the trick in such periods is to keep out of trouble.” Eventually the markets wake up, and when they do, that's when "all hell will break loose." When that moment comes, Singer is confident he will be ready.

Keep following JustSignals using Twitter, @StockTwits or Follow By Email. Just submit your email address in the box on the Blog homepage. This has been posted for Educational Purposes Only.   Do your own work and consult with Professionals before making any investment decisions.  Past performance is not indicative of future results


Mark Yusko is saying......

By BusinessInsider.com
MARK YUSKO: 'The US is going to have a crash and it will be massive'
“I’m telling you right now, the US is going to have a crash and it will be massive,” asserted Mark Yusko at Mauldin Economics’ Strategic Investment Conference.
In his keynote speech, Mark Yusko, CIO of Morgan Creek Capital Management, outlined where he sees the biggest opportunities and risks for investors are today.

Demographics Are Destiny 

Mark began with the big story of the SIC 2017 — demographics.
He believes that efforts to generate growth through fiscal stimulus and tax cuts will prove futile because the working-age population in the US is declining. As such, consumption—which makes up 70% of the US—will continue to fall.
Mark thinks instead of taking off, the US economy is on the cusp of a recession.

Headed for Recession

Mark points to key indicators such as credit growth and tax revenues, which are declining, as proof a recession is around the corner.


Source: St. Louis Fed
“Every time a President leaves the White House after two terms, there is a recession within the first year of the new administration. I believe this time will be no different.”
So, what does this mean for investors?

Sell US Stocks

Since 2012, the earnings of S&P 500 companies have gone nowhere, yet the market is up 70%. This rise has all been multiple expansions. As such, US equities are one of the most expensive class of assets in the world today.
With the S&P 500 trading at record highs, top investment management firm GMO projects returns will be negative over the next seven years.

Click on or use the following link to read the full article:
 http://www.businessinsider.com/mark-yusko-us-recession-2017-5

Keep following JustSignals using Twitter, @StockTwits or Follow By Email. Just submit your email address in the box on the Blog homepage. This has been posted for Educational Purposes Only.   Do your own work and consult with Professionals before making any investment decisions.  Past performance is not indicative of future results


Thursday, May 25, 2017

SentimenTrader noticed this !

Saw this on Twitter today !

Courtesy of Twitter and SentimenTrader


Keep following JustSignals using Twitter, @StockTwits or Follow By Email. Just submit your email address in the box on the Blog homepage. This has been posted for Educational Purposes Only.   Do your own work and consult with Professionals before making any investment decisions.  Past performance is not indicative of future results

Wednesday, May 24, 2017

Review of Picasso LT Cycles

From May 17,2017 post
Long term indicators appear positive, so far.  Negative divergence on many indicators were broken very late last year and so they now suggest further upside.  So, if pullbacks develop into the Picasso cycle date lows and daily indicators are OverSold, it may present a good buying opportunity.
In addition, the LT cycles appear to have shifted.  The LT cycles now suggest a high around April-June +/-, a low in August +/- & a high in November +/-. 
Always remember to confirm cycle dates with your or your professional investment advisors analysis.


Comments on the above
Since we are now past the middle window of a suggested high around April-June+/-, we are now watching very carefully for a breakdown on the Daily chart and a confirmation on the Weekly chart.
This will tell us "if "and "when" an August +/- low will happen or may happen.

*If this low does occur, based on other indicators such as, the Zweig Breadth Thrust of Nov.2016, the current Advance Decline Line highs, Sam Stovall's Jan & Feb Indicator, new Margin Debt highs, Picasso's Long Term Cycles, the AAII Bullish percentage dipped below 25,  then we "should" expect the market to be a buying opportunity.
The items just mentioned were discussed in detail in posts made over the last 12 months on the Blog.
  
Keep following JustSignals using Twitter, @StockTwits or Follow By Email. Just submit your email address in the box on the Blog homepage. This has been posted for Educational Purposes Only.   Do your own work and consult with Professionals before making any investment decisions.  Past performance is not indicative of future results

Thursday, May 18, 2017

AAII Bullish %

Dr. Aubie Baltin CFA, CTA, CFP, PhD., Palm Beach Gardens, FL 33418, and writer of the market newsletter, UNCOMMON COMMON SENSE,  once wrote that the stock market tends to rally for approx 3-6 months when the AAII bullish reading is under 25.

Recent dates when the AAII Bullish % was less than 25.00
June 9,2011    24.40  - Sell off into Aug 2011 before continuing higher
May 16,2012  23.60  - Market continued higher
July 18,2012   22.20  - Market continued higher
April 10,2013 19.30  - Market continued higher
June 10,2015  20.00  - Sell off into Aug 2015, but same level 5 months later
July 1,2015     22.60  - Sell off into Aug 2015, but same level 4 months later
July 29,2015   21.10  - Sell off into Aug 2015, but same level 3 months later
Aug 5,2015     24.30  - Sell off into Aug 2015, but same level 3 months later
Dec 16,2015   23.90  - Sell off into Jan 2016, but higher level 4-6 months later
May 4,2016    22.30  - Market continued higher
Sep 21,2016   24.83  - Market continued higher
*May 17,2017  23.90  - ???

Bullish %'s below 25.00% suggests that the market may rally 3-6 months out.  If Aubie Baltin is correct again, then it certainly agrees with the suggestions of the Picasso Long Term Cycles of a August low (*May plus 3 months) and a November high (*May plus 6 months).

JustSignals posts for the Long Term Cycles have been suggesting:
Long term indicators appear positive, so far.  Negative divergence on many indicators were broken very late last year and so they now suggest further upside.  So, if pullbacks develop into the Picasso cycle date lows and daily indicators are OverSold, it may present a good buying opportunity.
In addition, the LT cycles appear to have shifted.  The LT cycles now suggest a high around April-June +/-, a low in August +/- & a high in November +/-. 
Always remember to confirm cycle dates with your or your professional investment advisors analysis.
 
*Also note that a change in trend took place in the month of August in 2010, 2011, 2013, 2014, 2015 and 2016.  Will it happen again in 2017 as Picasso Long Term Cycles suggest?


Keep following JustSignals using Twitter, @StockTwits or Follow By Email. Just submit your email address in the box on the Blog homepage. This has been posted for Educational Purposes Only.   Do your own work and consult with Professionals before making any investment decisions.  Past performance is not indicative of future results

Wednesday, May 17, 2017

Picasso Cycle Update

In this update only the date/s will be mentioned with an "H" for high and a "L" for low.
The chart amplitude can and will be misleading at times.
In addition, it is the date/s that is most important rather than if that date is a projected high or low.
One important reason is because in some cases a date may invert and the "H" or "L" may not mean anything.
A low may actually turn out to be a high and visa versa.
Also it is very important that other tools always be used to confirm any potential ST Cycle Date. 

Picasso Dates, always +/- 
Mar 3-14 H - high occurred on Mar 15th
Mar 20-28 L - possible low occurring in this time frame - Low occurred on March 27th
Apr 10-13 H (+/-) - high occurred on April 5th & later on Apr 10th
Apr 4/21-24 L (+/-) - lows occurred on April 13th, 18th, 19th, 21st
Apr 28- May8 H - highs on April 26th & May 9th...only 3 day correction, then grinded higher
May 21 L 
May 25-June 1 H
June 10-19 L

Comments
See new comments in blue above and below.

Long term indicators appear positive, so far.  Negative divergence on many indicators were broken very late last year and so they now suggest further upside.  So, if pullbacks develop into the Picasso cycle date lows and daily indicators are OverSold, it may present a good buying opportunity.
In addition, the LT cycles appear to have shifted.  The LT cycles now suggest a high around April-June +/-, a low in August +/- & a high in November +/-. 
Always remember to confirm cycle dates with your or your professional investment advisors analysis.

Keep following JustSignals using Twitter, @StockTwits or Follow By Email. Just submit your email address in the box on the Blog homepage. This has been posted for Educational Purposes Only.   Do your own work and consult with Professionals before making any investment decisions.  Past performance is not indicative of future results

Wednesday, May 10, 2017

Glenn Neely from NEoWave

The following email was sent recently from Glenn Neely of NEoWave, Inc.
It is one persons opinion, so JustSignals is providing charts of each of these dates, below along with a few comments.

By Glenn Neely:
In the last 35-years, there have been ONLY 4 occasions when I was certain a stock market crash was coming – they were the high in 1987, the high in 2000 (the internet bubble), the end of the real estate boom in early 2008 and the high made August 2015. In ALL cases, a massive decline followed.

At this time, based on all the things I know about the U.S. stock market (current Wave structure implications, U.S. margin debt, insider traders selling stock, overbought warnings from my Moat Index, a rising interest rate environment and the volume of new accounts being opened at brokerage firms in 2017 around the country), THIS is the FIRST TIME since August 2015 that I'm VERY concerned a "Stock Market Crash" is just 1-3 months away.

The two ingredients currently missing from the typical setup for a major market top is volatility (which is normally high at major tops and bottoms) and widespread media coverage. With those two elements absent, the S&P might need to undergo a violent "blow off" in the next 1-2 months. Such behavior will increase volatility and definitely get the attention of the main stream media.

Whether the S&P soars to new highs over the next 1-2 months and volatility increases OR the S&P simply sells off and begins a violent decline from a lower high, the odds are EXTREMELY HIGH - in the next 1-3 months - that the U.S. stock market will experience its largest, fastest decline in 10 years! That violent drop will be the start of a 2-4 year bear market that retraces at least 50% of the 2009-2017 bull market. If you look at the attached long-term (6-monthly) chart, you can see my best guess at Wave structure back to 2000's high and the S&P current position and what I expect (the red-dashed line). Keep in mind, a "blow off" advance of 5-10% might occur this month or next BEFORE the crash begins. Either way, I'm fairly confident a multi-year bear market will begin in 2017.

We can only guess what might instigate the next bear market but many possibilities exist. The Fed continuing to raise interest rates historically is enough. The tensions between North Korea, China, the U.S. and Russia is another factor. Massive borrowing by U.S. corporations to buy their own stock, which will eventually have to be paid back, is another concern. Eventually, the cause of the bear market will be decided but, in the mean time, you should prepare.

To help you navigate the coming bear market, we are offering a 25% discount on all NEoWave Trading and Forecasting services. To receive your discount, please contact  Magelan@neowave.com 

Sincerely,
Glenn Neely
NEoWave, Inc.
Email: magelan@neowave.com

The following charts & comments are provided by JustSignals

1987 daily DJIA - Courtesy of Worden Bros.

2000 weekly SPY - Courtesy of eSignal

2008 weekly SPY - Courtesy of eSignal

2015, 2016, 2017 weekly SPY - Courtesy of eSignal
The charts above are from each date that Glenn Neely mentioned. 
In each of these charts for each date Glenn Neely mentioned, there were warning signs before the correction.  If you look carefully at the current period in the last chart, there aren't any similar warning signs appearing yet.  Although there are some recent posts here that do suggest some weakness developing in the stock market.

Glenn Neely is a respected market technician with many innovative tools that have made many good calls in the stock market and since he said "THIS is the FIRST TIME since August 2015 that I'm VERY concerned a "Stock Market Crash" is just 1-3 months away",  this will be watched very carefully !!! 

Keep following JustSignals using Twitter, @StockTwits or Follow By Email. Just submit your email address in the box on the Blog homepage. This has been posted for Educational Purposes Only.   Do your own work and consult with Professionals before making any investment decisions.  Past performance is not indicative of future results

Tuesday, May 9, 2017

chart: SPY vs Hi-Lo 10dma ! MUST SEE !


This chart is self explanatory !
See the negative divergence ?

Keep following JustSignals using Twitter, @StockTwits or Follow By Email. Just submit your email address in the box on the Blog homepage. This has been posted for Educational Purposes Only.   Do your own work and consult with Professionals before making any investment decisions.  Past performance is not indicative of future results

Thursday, May 4, 2017

charts: S&P500 with buy & sell signals

Courtesy of Worden Bros.

Courtesy of Worden Bros.
The S&P500 is shown with 1)McClellan Summation Index, and 2)% of stocks above the 40DMA.
Each is self explanatory and each is at a possible Change In Trend as shown as of today's price bar.

Keep following JustSignals using Twitter, @StockTwits or Follow By Email. Just submit your email address in the box on the Blog homepage. This has been posted for Educational Purposes Only.   Do your own work and consult with Professionals before making any investment decisions.  Past performance is not indicative of future results

Tuesday, May 2, 2017

Picasso Cycle Update

In this update only the date/s will be mentioned with an "H" for high and a "L" for low.
The chart amplitude can and will be misleading at times.
In addition, it is the date/s that is most important rather than if that date is a projected high or low.
One important reason is because in some cases a date may invert and the "H" or "L" may not mean anything.
A low may actually turn out to be a high and visa versa.
Also it is very important that other tools always be used to confirm any potential ST Cycle Date. 

Picasso Dates, always +/- 
Mar 3-14 H - high occurred on Mar 15th
Mar 20-28 L - possible low occurring in this time frame - Low occurred on March 27th
Apr 10-13 H (+/-) - high occurred on April 5th & later on Apr 10th
Apr 4/21-24 L (+/-) - lows occurred on April 13th, 18th, 19th, 21st
Apr 28- May8 H 
May 21 L

Comments
See new comments in blue above and below.

Long term indicators appear positive, so far.  Negative divergence on many indicators were broken very late last year and so they now suggest further upside.  So, if pullbacks develop into the Picasso cycle date lows and daily indicators are OverSold, it may present a good buying opportunity.
In addition, the LT cycles appear to have shifted.  The LT cycles now suggest a high around April-June +/-, a low in August +/- & a high in November +/-. 
Always remember to confirm cycle dates with your or your professional investment advisors analysis.

Keep following JustSignals using Twitter, @StockTwits or Follow By Email. Just submit your email address in the box on the Blog homepage. This has been posted for Educational Purposes Only.   Do your own work and consult with Professionals before making any investment decisions.  Past performance is not indicative of future results