Sunday, November 13, 2016

charts: >5% NYSE issues hitting New Highs & New Lows

Nov 11, 2016
By Dana Lyons
J. Lyons Fund Management Inc.


For the full article and charts, use the following link:
http://jlfmi.tumblr.com/post/153051852470/is-abundance-of-new-highs-and-new-lows-a-bad-omen


Additional comments by:
On Twitter By   Hey Now


Keep following JustSignals using Twitter, @StockTwits or Follow By Email. 
Just submit your email address in the box on the Blog homepage
This has been posted for Educational Purposes Only.   Do your own work and consult with Professionals before making any investment decisions.  
Past performance is not indicative of future results


charts: The Day after the Election

Courtesy of Nautilus Capital

Keep following JustSignals using Twitter, @StockTwits or Follow By Email. 
Just submit your email address in the box on the Blog homepage
This has been posted for Educational Purposes Only.   Do your own work and consult with Professionals before making any investment decisions.  
Past performance is not indicative of future results

Friday, November 11, 2016

charts: Presidential Cycle Patterns

Chart In Focus, by Tom McClellan
The Market, Under a New President


November 10, 2016

Investors get fearful ahead of a big election, because the outcome is unknown.  Unknown risks are what investors fear most.  Now that the result is decided, we have known risks to deal with. 
Investors were also fearful ahead of the 2012 election, which also had a surprising (for some) result.  Recall that Gov. Romney had been up by 1-4% in the last polls leading up to that election.  Polling that year was admittedly disrupted by the arrival of Hurricane Sandy, which also shut down the stock market for 2 days. 
And interestingly, the market now is doing a pretty good imitation of the path of price movements 4 years ago.  In 2012 there was a dip into mid-November after the Nov. 6 election.  This time it was a dip the week before the Nov. 8 election.  But in each case there has also been a strong rebound after that dip. 
You may have heard before that having a Democrat president is better for the stock market than having a Republican president, and there are statistics which can be used to support that.  In the following chart, the averages for each category since 1933 are plotted:

The real truth is a lot more nuanced than just saying one is better than the other.  On average, the market has performed better for the first 16 months of Democrats’ terms,  but then by the 3rd year that advantage completely disappears.  And market performance in the 4th year is worse on average under a Republican president.  A big part of that is the weakness after the Oct. 1987 crash, and from the 2008 bear market,  both of which happened under Republican presidents. 
Another differentiation among presidents concerns whether there is a new president from a different party, versus a 2nd term president or a new one from the same party.  This one is a much bigger deal, especially during the first year of a new presidential term. 
Generally speaking, investors respond more favorably at first to getting a new president from a different party.  This has to do with celebrating that they got the change they wanted (or so they think).  That positive emotion tends to wear off right around inauguration day, when they realize that the new president has not fixed all of the problems already. 
The negativity under a new president persists as the year runs on, because of a habit they all seem to have.  I have seen this same behavior repeatedly over my lifetime.  A new president comes in, and spends his first year “discovering” that conditions are even worse than we were told during the campaign, and then tells us that “the only solution” is whatever package of tax hikes/cuts or spending adjustments he wants to make.
Bill Clinton did this in 1993.  Despite 5% GDP growth then, Clinton asserted that “This is the worst recession in 50 years,” and he wanted to jam through a $20 billion package of pork barrel spending (mostly to reward campaign contributors).  Congress wisely said no.  When I think back on that, I realize that $20 billion is such a cute little number compared to the size of the “fixes” that have come since then.
With Bush 43 in 2001, it was tax cuts, although he could not get all he wanted right away and had to do another round in 2003.  With Barack Obama in 2009, it was the American Recovery and Reinvestment Act, with $831 billion in stimulus spending (see why $20 billion is a cute little number)?  They all seem to do it. 
Investors generally don’t like hearing that things are worse than previously believed, and that creates a depressing effect on stock prices during a first year.  Generally speaking, 2nd term presidents do not spend very much time blaming the immediate predecessor, or finding things wrong, and so investors don’t get frightened away as much.  But as noted previously, that difference in stock market performance between 1st and 2nd term presidents generally goes away by the end of the 2nd year.
Every instance is different, and these charts just show what the average behavior has been. 
Tom McClellan
Editor, The McClellan Market Report
www.mcoscillator.com
(253) 581-4889 

Keep following JustSignals using Twitter, @StockTwits or Follow By Email. 
Just submit your email address in the box on the Blog homepage
This has been posted for Educational Purposes Only.   Do your own work and consult with Professionals before making any investment decisions.  
Past performance is not indicative of future results

Tuesday, November 8, 2016

charts: FTSE brexit vs DJIA election Comp

Courtesy of Worden Bros.
If you look at each chart within the blue rectangle, you will see a very similar price pattern.
The BREXIT vote was on June 23,2016.

Keep following JustSignals using Twitter, @StockTwits or Follow By Email. 
Just submit your email address in the box on the Blog homepage
This has been posted for Educational Purposes Only.   Do your own work and consult with Professionals before making any investment decisions.  
Past performance is not indicative of future results


Monday, November 7, 2016

Chart: ChaikinAnalytics - DIA

Courtesy of ChaikinAnalytics.com
Keep following JustSignals using Twitter, @StockTwits or Follow By Email. 
Just submit your email address in the box on the Blog homepage
This has been posted for Educational Purposes Only.   Do your own work and consult with Professionals before making any investment decisions.  
Past performance is not indicative of future results

Saturday, November 5, 2016

charts: SPY vs MMF & Bullish %


Description of Funds used in the above charts
SPY -  ETF proxy for the S&P500

RYFXX - (money is parked here when not invested) - The U.S. Money Market Funds seeks to provide security of principal, high current income, and liquidity.


RYNVX - (long fund) - Intended for investors who expect the S&P 500® Index to go up and want accelerated investment gains when it does so. However, there is an increased risk of accelerated losses if the market declines.

RYURX -  (short fund) - Provides an alternative to shorting individual stocks.  A potential portfolio hedge against market declines due to its inverse correlation to the underlying benchmark.

Comments
The charts are all from March 2009 to the present.
The scale on the MMF chart was inverted to correlate highs and lows with the SPY.  When investors and traders sell their positions, that money gets parked in the MMF until they reinvest it.  Back in March 2009 when the stock market bottomed, investors and traders had been selling their positions for months.  The MMF had grown to approximtely $1,370.0Bil.  When the stock market reversed and started to go up, investors and traders took their money parked in the MMF and put it to work in various funds, the amount of money in the MMF gets reduced.   You can see this in the chart.  Several highs and lows in the SPY was pointed out with blue vertical lines for lows and red vertical lines for highs.  As you can see the highs and lows in both are similar, since the MMF scale was inverted.
Currently the MMF is about $450Mil and the lowest amount since March 2009, indicted by the red circle.  This maybe concerning that highs have been made with larger amounts in the MMF. 

Keep following JustSignals using Twitter, @StockTwits or Follow By Email. 
Just submit your email address in the box on the Blog homepage
This has been posted for Educational Purposes Only.   Do your own work and consult with Professionals before making any investment decisions.  
Past performance is not indicative of future results

Thursday, November 3, 2016

charts: Fear & Greed Index

Courtesy of CNN/Money
Today the Fear Index reading is 15, pretty low. 
When you are in the 80+/- range you are generally near or at OB and you wait for sell signals to suggest RISK OFF. 
When you are in the 20+/- range you are generally near or at OS and you wait for buy signals to suggest RISK ON. 

Keep following JustSignals using Twitter, @StockTwits or Follow By Email. 
Just submit your email address in the box on the Blog homepage
This has been posted for Educational Purposes Only.   Do your own work and consult with Professionals before making any investment decisions.  
Past performance is not indicative of future results


Wednesday, November 2, 2016

Sam Stovall told CNBC...

By Business Insider - Sam Stovall told CNBC

One metric has accurately predicted the outcome of every presidential election since 1984 — the strength of the S&P 500 Index.
And right now, the S&P 500 is pointing to a Donald Trump victory on Election Day.
Bloomberg and CNBC noted this week that the stock market's decline does not bode well for Hillary Clinton, the nominee for the incumbent Democratic party.
"Going back to World War II, the S&P 500 performance between July 31 and October 31 has accurately predicted a challenger victory 86% of the time when the stock market performance has been negative," Sam Stovall, chief investment strategist at CFRA, told CNBC.
When stocks are going up, the incumbent party tends to win the White House. But the S&P 500 is down 2.2% since the last trading day of July.
Still, this election has hardly abided by historical standards. And the downturn in the stock market could actually be a result of election anxiety.
"This time around if the Democrats retain the White House, I will come up with two responses," Stovall told CNBC. "One is that history is a guide but never gospel, and two, the negative performance by the market could be a reflection of the worry of domination that a Democratic sweep would bring."
As Business Insider's Elena Holodny noted this week, when it comes to markets, the past does not predict the future.
Daniel Clifton at Strategas Research Partners gave Business Insider additional context about this indicator earlier this year:
"Intuitively, this trend makes sense. If the economy is weakening, stocks should be declining and the incumbent party will likely suffer. Moreover, should it look like a new party is to take control of the White House, the change in control could add uncertainty to investors until the new President gets his or her rhythm."
"In fact, we have found that 'open' election years, a year in which no incumbent is up for re-election have been tougher for stocks than presidential reelection and non-presidential election years. Interestingly, stocks have rallied in the past two (and rare) instances when a political party has received a 3rd term."
"The S&P 500 increased 30 and 27% respectively in the year after Harry Truman won in 1948 and George H.W. Bush won in 1988. Sometimes the devil you know is better than the devil you don't know."
Other unconventional indicators have also indicated a Trump win on November 8.
An artificial intelligence system that has correctly predicted the past three presidential elections as well as the Democratic and Republican primaries said Trump will likely win, and a professor who has accurately predicted the outcome of every presidential election since 1984 came to the same conclusion last month based on a model he developed that uses a series of true/false statements to determine who is best positioned to take the White House.
And after the FBI announced that it's reopening its investigation related to Clinton's use of a private email server during her time at the State Department, the polls started tightening, putting Trump within striking distance of Clinton.

Keep following JustSignals using Twitter, @StockTwits or Follow By Email. 
Just submit your email address in the box on the Blog homepage
This has been posted for Educational Purposes Only.   Do your own work and consult with Professionals before making any investment decisions.  
Past performance is not indicative of future results

chart: SPY Monthly signals

Courtesy of eSignal
A certain amount of caution should be demonstrated at this point.  Watch your charts for any signals confirming or not confirming the caution light.

Keep following JustSignals using Twitter, @StockTwits or Follow By Email. 
Just submit your email address in the box on the Blog homepage
This has been posted for Educational Purposes Only.   Do your own work and consult with Professionals before making any investment decisions.  
Past performance is not indicative of future results

Tuesday, November 1, 2016

chart: SPY vs 10DMA Highs-Lows


The 10DMA of Highs - Lows has made a lower low today, red circle.   Up until today, the 10DMA of Highs-Lows was potentially setting up a positive divergence with the SPY.  But after today that scenario does not exist.

This along with the previous post of weaker Buying Pressure may be evidence of a stock market that is trying to go lower.  Maybe after a short bounce in a technically OS stock market.  
How low though is not known.   See the previous post of the Buying Pressure.  On that chart you will see several times when the market did go lower, before and after a bounce.

Keep following JustSignals using Twitter, @StockTwits or Follow By Email. 
Just submit your email address in the box on the Blog homepage
This has been posted for Educational Purposes Only.   Do your own work and consult with Professionals before making any investment decisions.  
Past performance is not indicative of future results

Monday, October 31, 2016

chart: Buying Pressure


Buying pressure at the close today made a recent low as indicated in the red circle.  The yellow lines are areas of previous lows and the red lines are subsequent price movements.
Usually the buying pressure displays positive and negative divergences.
We do not have a positive divergence setup yet.

Keep following JustSignals using Twitter, @StockTwits or Follow By Email. 
Just submit your email address in the box on the Blog homepage
This has been posted for Educational Purposes Only.   Do your own work and consult with Professionals before making any investment decisions.  
Past performance is not indicative of future results

charts: Earl & Earl2 and stocks after the election

By Danny of LunaticTrader.com

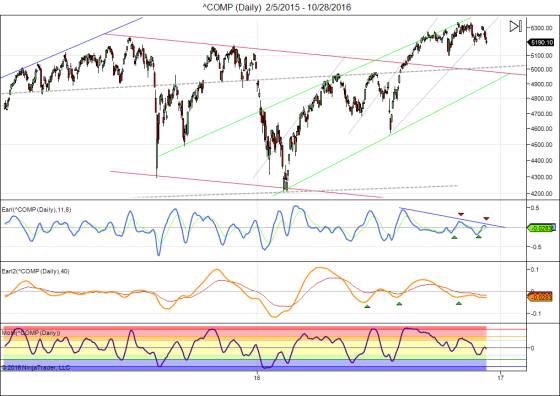
Stocks came under some pressure last week and the S&P 500 is struggling to say above the important 2120 support level. As we pointed out last week, price action has been weak and there is nothing going on as long as there is no clear breakout, up or down. We are still in that situation but now my indicators are starting to turn down, suggesting that a breakout to the downside is gradually becoming the more likely scenario. Here is the current Nasdaq chart:
comp-daily-2_5_2015-10_28_2016
Earl and MoM indicators have turned down after a very weak rally attempt and the slower Earl2 is languishing at low levels, apparently unable to get back above the zero line. The lunar green period will be ending later his week and it looks like we will be lucky if it ends near breakeven for the period. This suggests the path of least resistance is down.
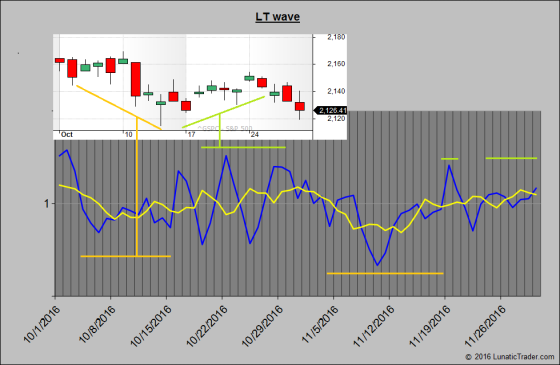
Looking at the LT wave chart for November offers more reason for caution:
ltwavenov2016
We got the expected weakness in the first half of October, but the positive bias after the 15th was very weak. Most of the peak LT wave values happened to come on weekend days when markets are closed, but the other days didn't produce any convincing green candles either.
Going into November the wave tries to hold up in the first days, but then shows a drop with weakness to continue until around the 17th. The rest of the month is hardly above neutral. The lowest LT wave value for the month comes on the 10th, and the high is projected for the 19th.
Does this mean the market will crash? No. Does this have anything to do with the upcoming US election? No. Four years ago when Obama was re-elected the S&P 500 dropped 6% in the next two weeks. I guess that whoever wins the election, some half of the population will be disappointed and may see it as a good reason to sell stocks. Everything is possible and there is no guarantee whatsoever that the projected LT wave pattern will pan out.
Keep following JustSignals using Twitter, @StockTwits or Follow By Email. 
Just submit your email address in the box on the Blog homepage
This has been posted for Educational Purposes Only.   Do your own work and consult with Professionals before making any investment decisions.  
Past performance is not indicative of future results

Sunday, October 30, 2016

chart: % stks above 40DMA

Courtesy of Worden Bros.
Looks like a breakout to the upside out of this triangle "may" be coming.
Watch out for any head fakes to the downside before turning up.

Keep following JustSignals using Twitter, @StockTwits or Follow By Email. 
Just submit your email address in the box on the Blog homepage
This has been posted for Educational Purposes Only.   Do your own work and consult with Professionals before making any investment decisions.  
Past performance is not indicative of future results

Friday, October 28, 2016

chart: Next 5 Days, Strong on heat map

Originally posted on Twitter on Oct 27,2016

Keep following JustSignals using Twitter, @StockTwits or Follow By Email. 
Just submit your email address in the box on the Blog homepage
This has been posted for Educational Purposes Only.   Do your own work and consult with Professionals before making any investment decisions.  
Past performance is not indicative of future results

Wednesday, October 26, 2016

chart: Harry Dent's Spending Wave


The above chart was updated in 2013.
In general the shape of the red spending wave and the blue line of the DJIA (adjusted for inflation) share a very common shape.  The yellow areas highlight common highs and lows.  The two black vertical lines display the 2016-17 forecast high and the 2020-22 forecast low.  What is very interesting is that JustSignals LT cycles are calling for similar highs and lows.  Rough times just ahead is a very good possibility, unfortunately.

Keep following JustSignals using Twitter, @StockTwits or Follow By Email. 
Just submit your email address in the box on the Blog homepage
This has been posted for Educational Purposes Only.   Do your own work and consult with Professionals before making any investment decisions.  
Past performance is not indicative of future results

Tuesday, October 25, 2016

charts: Dow Theory divergence

By Wikipedia

Stock market averages must confirm each other
In Dow's time, the US was a growing industrial power. The US had population centers but factories were scattered throughout the country. Factories had to ship their goods to market, usually by rail. Dow's first stock averages were an index of industrial (manufacturing) companies and rail companies. To Dow, a bull market in industrials could not occur unless the railway average rallied as well, usually first. According to this logic, if manufacturers' profits are rising, it follows that they are producing more. If they produce more, then they have to ship more goods to consumers. Hence, if an investor is looking for signs of health in manufacturers, he or she should look at the performance of the companies that ship their output to market, the railroads. The two averages should be moving in the same direction. When the performance of the averages diverge, it is a warning that change is in the air.
 
Courtesy of Worden Bros.
 Keep following JustSignals using Twitter, @StockTwits or Follow By Email. 
Just submit your email address in the box on the Blog homepage
This has been posted for Educational Purposes Only.   Do your own work and consult with Professionals before making any investment decisions.  
Past performance is not indicative of future results


Sy Harding's STS

Excerpts from "Beat the Market the Easy Way" by Sy Harding

"Sell in May and Go Away"
"Ned Davis Research Inc. published numerous studies showing the positive  historical results of being invested in the markets for the seven month period of October 1 to May 1, and being in cash the other five months."
"Thus an investor standing aside during the market's infavorable seasons not only matched the buy and hold performance of the S&P 500 and did so with only 50% of market risk, but also avoided the emotional stress  of seeing portfolios often plunge precipitously during unfavorable seasons."

  "IT IS NOT A FIXED 6-MONTHS IN, 6-MONTHS OUT!"

It is BEST to read this book.  The book is available at many libraries, either in paper or digital versions or it can be purchased easily online.

In summary, after the research made by Ned Davis Research Inc., Yale Hirsch of the Hirsch Organization and Alan Newman, editor of the Crosscurrents newsletter, Sy Harding's firm, Asset Management Research Corp. conducted more detailed research.  In their research they found that when the Moving Average Convergence Divergence (MACD), developed by Gerald Appel, was applied, the performance was much better.
"It works this way in our (Sy Harding's) seasonal strategy."
"If MACD is on a technical buy signal, indicating a rally is underway, when the October 16 earliest calendar date for seasonal entry arrives, we will enter at that time."
"However, if the MACD indicator is on a sell signal when the October 16 calendar date arrives, indicating a market decline is underway it would not make sense to enter before that decline ends, even though the average best calendar entry date has arrived.  In that event, our (Sy Harding's) Seasonal Timing Strategy simply waits to enter until MACD gives it's next buy signal, indicting that the decline has ended."
Use the same method in reverse when April 20 arrives to better pinpoint the end of the markets favorable period in the Spring.

Please take the time to read Sy Harding's book.  It is relatively short and easy to read and it has many more exciting findings by Sy Harding.
Courtesy of Worden Bros. Oct 25,2016
Keep following JustSignals using Twitter, @StockTwits or Follow By Email. 
Just submit your email address in the box on the Blog homepage
This has been posted for Educational Purposes Only.   Do your own work and consult with Professionals before making any investment decisions.  
Past performance is not indicative of future results

Monday, October 24, 2016

Earl & Earl2

By Danny of LunaticTrader.com

The S&P 500 is more or less where it was in mid July, and except for a few volatile days in early September the market has hardly moved.
Some people will blame it on the upcoming elections, but this kind of go-nowhere periods also happen when there are no elections. One thing is clear: this too will pass, we just don't know when.
Let's have a look at the current S&P chart:
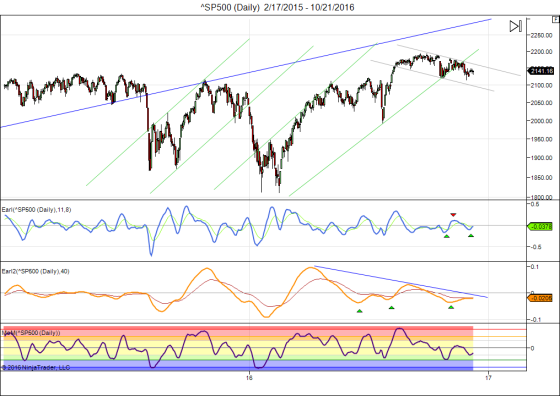
sp500-daily-2_17_2015-10_21_2016
Stocks appear to be trying the upside again after holding the important 2120 support. But it is not a convincing rally attempt so far.
The S&P is in a mild down trend channel (grey lines) and how it emerges from it is likely to decide on the next major move. All we can do is wait.
 Keep following JustSignals using Twitter, @StockTwits or Follow By Email. Just submit your email address in the box on the Blog homepageThis has been posted for Educational Purposes Only.   Do your own work and consult with Professionals before making any investment decisions.  Past performance is not indicative of future results

Wednesday, October 12, 2016

29 Year Cycle


1929 crash, October 1929
+29
=1958  Eisenhower recession
+29
=1987 crash, October 1987
+29
=2016 ?

Keep following JustSignals using Twitter, @StockTwits or Follow By Email. Just submit your email address in the box on the Blog homepageThis has been posted for Educational Purposes Only.   Do your own work and consult with Professionals before making any investment decisions.  Past performance is not indicative of future results

Monday, October 10, 2016

Picasso Cycle Dates

The following was posted on September 25,2016.
The Picasso Cycle Dates have been working very well recently.
The next group of Picasso Cycle Dates will be posted shortly.

In this update only the dates will be mentioned with an "H" for high and a "L" for low.
The chart amplitude can and will be misleading at times.
In addition, it is the date that is most important rather than if that date is a projected high or low with amplitude as sometimes shown on the chart.
One important reason is because in some cases a date may invert and the amplitude and the "H" or "L" may not mean anything.
A low may actually turn out to be a high and visa versa.
Also it is very important that other tools always be used to confirm any potential ST Cycle Date.

Picasso Dates, always +/-
8/31-9/3* H
9/17 L
9/20-26 H
10/5-9 L
10/17-18 H

* Note that 9/3 is an Anniversary Date of the 1929 high on 9/3/1929


Keep following JustSignals using Twitter, @StockTwits or Follow By Email. Just submit your email address in the box on the Blog homepageThis has been posted for Educational Purposes Only.   Do your own work and consult with Professionals before making any investment decisions.  Past performance is not indicative of future results
Best 6 months & MACD

Best 6 months and MACD
 
05-06-2014, 10:43 AM | Post #3539907
See how it works below.

To see when to sell look here

April 20 had MACD at a buy signal, you need to wait for the next sell signal. Looking at the chart...it's today.
==========================
As you are probably already aware, after decades of historical research, we discovered that most of the market’s gains occur during the months November through April. An analysis of the average gains for each month shows that November, December, January, March and April have been outstanding months since 1950. Add February and our “Best Six Months” strategy is born.
Market timer Sy Harding, in his book, Riding The Bear, took our November-through-April strategy, enhanced it, and termed it the “Best mechanical system ever.” He simply used the MACD indicator developed by our old friend Gerald Appel to enter the “Best Six Months” period up to several weeks earlier, if the market was in an uptrend. Conversely, Harding would exit up to several weeks later as long as the market kept moving up.
The key here is using the MACD indicator in conjunction with other tools like our “Best Six Months” strategy to confirm or assist in timing, buy and sell decisions. So once we enter April or October we begin tracking MACD.

This is what Sy Harding says:

http://www.streetsmartreport.com/sts.html
We discovered that those best days on average are October 16 for the entry into the market for its favorable seasonal period, and April 20 for the exit from the market’s favorable season. However, those are just the best days as averaged over a very long time period.Obviously the market does not begin a rally on the same day each year, or begin to decline from a top on the same day each year. And recognition of that obvious fact is the most important aspect of our strategy.
So we then concentrated on determining a means by which the entries and exits could be more accurately pinpointed for each individual year.
The result was our Seasonal Timing Strategy, or STS.
Since the market does not begin or end its positive period on the same day each year, we combined the market’s best average calendar entry and exit day with a technical indicator, the Moving Average Convergence Divergence indicator, or MACD. It is a short-term momentum-reversal indicator developed by Gerald Appel in the 1980s, designed to signal when the market has begun either a short-term rally, or a short-term correction. 
The idea is that if a rally is underway when the October 16 calendar date for seasonal entry arrives, as indicated by the MACD indicator, we will enter at that time. However,if the MACD indicator is on a sell signal when the October 16 calendar date arrives, indicating a market decline is underway, it would not make sense to enter before that decline ends, even though the best average calendar entry date has arrived. Instead, our Seasonal Timing Strategy simply waits to enter until MACD gives its next buy signal, indicating that the decline has ended.
We use the same method to better pinpoint the end of the market’s favorable period in the spring. If MACD is on a sell signal when the calendar exit day of April 20 arrives, we exit at that point. However,if the technical indicator is on a buy signal, indicating the market is in a rally when April 20 arrives, it makes no sense to exit the market just because the calendar date has arrived. So our Seasonal Timing Strategy’s ‘exit rule’ is to simply remain in the market until MACD triggers its next sell signal indicating the rally has ended.


http://www.stocktradersalmanac.com/sta/research_tool_MACDEntryExitDOW.jsp

Keep following JustSignals using Twitter, @StockTwits or Follow By Email. Just submit your email address in the box on the Blog homepageThis has been posted for Educational Purposes Only.   Do your own work and consult with Professionals before making any investment decisions.  Past performance is not indicative of future results
Tuesday, September 27, 2016

chart: Silver


Below looks at a chart on Silver, dating back to the early 1970’s. Silver created an important top at $50 in 1980, did it create another important top at the same price in 2011?
Courtesy of KimbleChartingSolutions.com

Silver hit $50 in 2011, which was the highs back in 1980 and since then, has created a series of lower highs and lower lows.
Silver is now testing a bunch of resistance lines and its Fibonacci 61% retracement level at (1), with bullish sentiment at lofty readings.
For Silver to break free from its trend of lower highs and lower lows, it needs to take out this “resistance bunch” to do so.
The Silver “Risk On” trade does not want to see selling take place below this key price zone at (1).

Keep following JustSignals using Twitter, @StockTwits or Follow By Email. Just submit your email address in the box on the Blog homepageThis has been posted for Educational Purposes Only.   Do your own work and consult with Professionals before making any investment decisions.  Past performance is not indicative of future results

Sunday, September 25, 2016

Picasso Cycle Dates Upddate

The following was posted on August 25,2016.
The Picasso Cycle Dates have been working very well recently.
The next group of Picasso Cycle Dates will be posted shortly.


In this update only the dates will be mentioned with an "H" for high and a "L" for low.
The chart amplitude can and will be misleading at times.
In addition, it is the date that is most important rather than if that date is a projected high or low with amplitude as sometimes shown on the chart.
One important reason is because in some cases a date may invert and the amplitude and the "H" or "L" may not mean anything.
A low may actually turn out to be a high and visa versa.
Also it is very important that other tools always be used to confirm any potential ST Cycle Date.

Picasso Dates, always +/-
8/31-9/3* H
9/17 L
9/20-26 H
10/5-9 L

* Note that 9/3 is an Anniversary Date of the 1929 high on 9/3/1929


Keep following JustSignals using Twitter, @StockTwits or Follow By Email. Just submit your email address in the box on the Blog homepageThis has been posted for Educational Purposes Only.   Do your own work and consult with Professionals before making any investment decisions.  Past performance is not indicative of future results

Tuesday, September 20, 2016

chart: SPY & Tom DeMark's REI

The following chart is the weekly SPY.  Below is the REI (range expansion index by Tom DeMark)


Weekly SPY
Green bars & Blue Circle - Over Sold and in an area where bottoms form

The Description
The DeMark Range Expansion Index is a market-timing oscillator described in DeMark on Day Trading Options, by T.R. DeMark and T.R. Demark, Jr., McGraw Hill, 1999. The oscillator is arithmetically calculated and is designed to overcome problems with exponentially calculated oscillators, like MACD. The TD REI oscillator typically produces values of -100 to +100 with 45 or higher indicating overbought conditions and -45 or lower indicating oversold. DeMark advises against trading in extreme overbought or oversold conditions indicated by six or more bars above or below the 45 thresholds. For more information on using TD REI the user is referred to the DeMark text.
 
Keep following JustSignals using Twitter, @StockTwits or Follow By Email. 
Just submit your email address in the box on the Blog homepage
This has been posted for Educational Purposes Only.   Do your own work and consult with Professionals before making any investment decisions.  
Past performance is not indicative of future results
 

Friday, September 16, 2016

charts: McClellan Osc Hi Yld Bd A-D & SP500

Chart In Focus, by Tom McClellan
McClellan Oscillator for High Yield Bond A-D Data

September 14, 2016

The regular McClellan Oscillator is based on Advance-Decline (A-D) data for the NYSE.  But the same calculation can be done on other sets of A-D data.  This week’s chart looks at an interesting example of that, with a big message for the current moment.
The Financial Industry Regulatory Authority (FINRA) kindly publishes data on Advances and Declines for corporate bonds, breaking out totals for Investment Grade, High Yield, and Convertible.  Each category is interesting in its own right, but I find the High Yield numbers the most interesting, perhaps because of the strong correlation that such bonds have to the movements of the stock market. 
This particular version of the McClellan Oscillator for High Yield Bonds is calculated the same way as for the NYSE A-D data.  But because the number of issues traded are different for each market, the raw scaling is therefore necessarily going to be different.  
Once we get past that notion of scaling, and just focus on the chart itself, we can pretty easily see where “high” and “low” readings are.  

 I drew a horizontal line at the arbitrarily chosen level of -75 to help focus the eye on the situation we see right now.  Very low readings below that line tend to reliably be associated with meaningful bottoms for the SP500.  I should caution that the notion of “meaningful” bottoms does not mean the same thing as “final” bottoms. 
But such bottoms are usually followed by meaningful bounces, if not outright up moves.  That is the important message.  What we are seeing with this very low reading is a message that the stock market is at a meaningful bottom and ought to see a brief pop, at a minimum.  What happens after that is a more difficult question to address.

It is not only the McClellan Oscillator for these data which has merit.  A raw Advance-Decline Line (A-D Line) can have value on its own, when it signals a trend change. 

When the High Yield Corporate Bond A-D Line crosses through a long trendline, it is a pretty darned good signal of a trend change.  Some examples are shown in this second chart. 
This is important now because we have just seen such a crossing, this time below the rising bottoms line that dates back to the Feb. 2016 low.  That line has been fairly authoritatively broken, and now this A-D Line is also threatening to close below its own 5% Trend (AKA 39-day EMA), an act which would add further confirmation of a trend change. 
High yield bonds had come back into fashion in 2016, as the central banks’ policies of zero or negative interest rate policy has pushed investors into more risky assets.  The pendulum appears to be swinging back again, although it has swung really far already on the first push, as evidenced by the extremely negative McClellan Oscillator reading shown above.  That says the initial down leg may have gone too far too fast all at once.
But the broken uptrend lines says we are seeing a significant trend change getting started right now.  Both messages are worth acknowledging.
Tom McClellan
Editor, The McClellan Market Report
www.mcoscillator.com
(253) 581-4889 

Keep following JustSignals using Twitter, @StockTwits or Follow By Email. 
Just submit your email address in the box on the Blog homepage
This has been posted for Educational Purposes Only.   Do your own work and consult with Professionals before making any investment decisions.  
Past performance is not indicative of future results

Thursday, September 15, 2016

chart: SPY vs 10dma Highs-Lows


Notice that positive and negative divergences work pretty well.
Waiting for the next one...

Keep following JustSignals using Twitter, @StockTwits or Follow By Email. 
Just submit your email address in the box on the Blog homepage
This has been posted for Educational Purposes Only.   Do your own work and consult with Professionals before making any investment decisions.  
Past performance is not indicative of future results

Friday, September 9, 2016

chart: SPY 30min signals

Courtesy of TradeStation.com
The SPY 30min chart gave some great signals and is still on a sell at 3:15pm today.

Keep following JustSignals using Twitter, @StockTwits or Follow By Email. 
Just submit your email address in the box on the Blog homepage
This has been posted for Educational Purposes Only.   Do your own work and consult with Professionals before making any investment decisions.  
Past performance is not indicative of future results

chart: Storm Coming?

Courtesy of Bloomberg TV
On Sept 2,2016 this chart of the JPY/BGN Currency, was shown on Bloomberg TV.  The moving averages (MA) are the 12 month MA & the 24 month MA.   It suggests that when the 12 month MA crosses the 24 month MA some type of crisis occurs as noted in this chart.  The green arrow shows that another cross over has occurred again.  

Keep following JustSignals using Twitter, @StockTwits or Follow By Email. 
Just submit your email address in the box on the Blog homepage
This has been posted for Educational Purposes Only.   Do your own work and consult with Professionals before making any investment decisions.  
Past performance is not indicative of future results

Sunday, September 4, 2016

NIRP as a real FED option

For the full article go to the following link
http://finance.yahoo.com/news/feds-janet-yellen-mulls-negative-interest-rates-183711629.html


Keep following JustSignals using Twitter, @StockTwits or Follow By Email. 
Just submit your email address in the box on the Blog homepage
This has been posted for Educational Purposes Only.   Do your own work and consult with Professionals before making any investment decisions.  
Past performance is not indicative of future results