Stocks
came under some pressure last week and the S&P 500 is struggling to
say above the important 2120 support level. As we pointed out last week,
price action has been weak and there is nothing going on as long as
there is no clear breakout, up or down. We are still in that situation
but now my indicators are starting to turn down, suggesting that a
breakout to the downside is gradually becoming the more likely scenario.
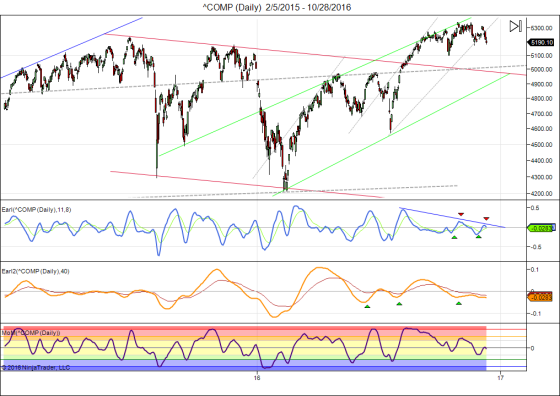
Here is the current Nasdaq chart:

Earl
and MoM indicators have turned down after a very weak rally attempt and
the slower Earl2 is languishing at low levels, apparently unable to get
back above the zero line. The lunar green period will be ending later
his week and it looks like we will be lucky if it ends near breakeven
for the period. This suggests the path of least resistance is down.
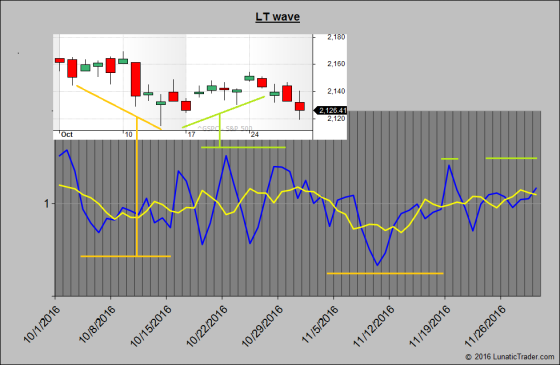
Looking at the LT wave chart for November offers more reason for caution:

We got the expected weakness in the first half of October,
but the positive bias after the 15th was very weak. Most of the peak LT
wave values happened to come on weekend days when markets are closed,
but the other days didn't produce any convincing green candles either.
Going into November the wave tries to hold up in the first days, but then shows a drop with weakness to continue until around the 17th. The rest of the month is hardly above neutral. The lowest LT wave value for the month comes on the 10th, and the high is projected for the 19th.
Does this mean the market will crash? No. Does this have anything to do with the upcoming US election? No. Four years ago when Obama was re-elected the S&P 500 dropped 6% in the next two weeks. I guess that whoever wins the election, some half of the population will be disappointed and may see it as a good reason to sell stocks. Everything is possible and there is no guarantee whatsoever that the projected LT wave pattern will pan out.
Keep following JustSignals using Twitter, @StockTwits or Follow By Email.
Just submit your email address in the box on the Blog homepage
This has been posted for Educational Purposes Only. Do your own work and consult with Professionals before making any investment decisions.
Past performance is not indicative of future results
Just submit your email address in the box on the Blog homepage
This has been posted for Educational Purposes Only. Do your own work and consult with Professionals before making any investment decisions.
Past performance is not indicative of future results
No comments:
Post a Comment
Note: Only a member of this blog may post a comment.