The
S&P 500 is more or less where it was in mid July, and except for a
few volatile days in early September the market has hardly moved.
Some people will blame it on the upcoming elections, but this kind of go-nowhere periods also happen when there are no elections. One thing is clear: this too will pass, we just don't know when.
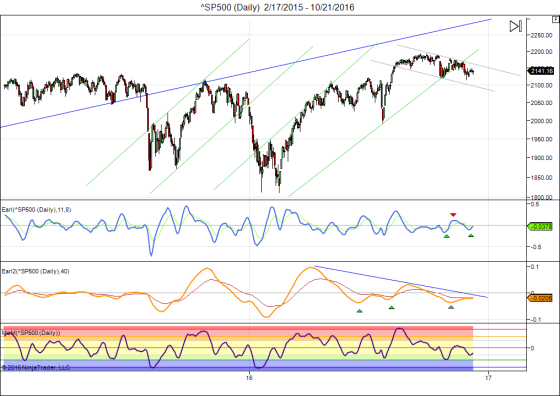
Let's have a look at the current S&P chart:
Some people will blame it on the upcoming elections, but this kind of go-nowhere periods also happen when there are no elections. One thing is clear: this too will pass, we just don't know when.
Let's have a look at the current S&P chart:

Stocks
appear to be trying the upside again after holding the important 2120
support. But it is not a convincing rally attempt so far.
The S&P is in a mild down trend channel (grey lines) and how it emerges from it is likely to decide on the next major move. All we can do is wait.
The S&P is in a mild down trend channel (grey lines) and how it emerges from it is likely to decide on the next major move. All we can do is wait.
Keep following JustSignals using Twitter, @StockTwits or Follow By Email. Just submit your email address in the box on the Blog homepageThis
has been posted for Educational Purposes Only. Do your own work and
consult with Professionals before making any investment decisions. Past performance is not indicative of future results
No comments:
Post a Comment
Note: Only a member of this blog may post a comment.