In this update only the date/s will be mentioned with an "H" for high and a "L" for low.
The chart amplitude can and will be misleading at times.
In addition, it is the date/s that is most important rather than if that
date is a projected high or low.
One important reason is because in some cases a date may invert and the "H" or "L" may not mean anything.
A low may actually turn out to be a high and visa versa.
Also it is very important that other tools always be used to confirm any potential ST Cycle Date.
Picasso Dates, always +/-
Aug 4-12 L - low was SPY 8/11
Aug 8/18-23 H - highs were made on 8/16 & 8/22
Aug 30-Sept 7 L - a low was made on 8/29
Sept 13-22 H - a high was made on 9/14
Sept 29-Oct 5 L - a low was made on 9/25 (left translation of this cycle date)
Oct 11-17 H - up into 10/18 and high made on 10/23
Oct 10/24-31L --->Sorry for the late posting of this date - Low on 10/25
Nov 11/6-9H
Comments:
Long term indicators appear positive, so far. Negative divergence on
many indicators were broken very late last year and so they now
suggest further upside. So, if pullbacks
develop into the Picasso cycle date lows and daily indicators
are OverSold, it may present a good buying opportunity.
So far this forecast came to pass. The
August low was accurate.
In addition, the LT cycles suggested a low in August +/-, which we had, &
a high in late November/early December +/-.
Always remember to confirm cycle dates with your indicators and or
your professional investment advisors analysis.
The LT Cycle low suggested for August was
shallow. The DJIA high was 22,179 and the DJIA low was 21,600. This
was a 2.6% correction. Not much, but, it was a correction as forecasted
nevertheless.
Keep following JustSignals using Twitter, @StockTwits or Follow By Email. Just submit your email address in the box on the Blog homepage. This
has been posted for Educational Purposes Only. Do your own work and
consult with Professionals before making any investment decisions. Past performance is not indicative of future results
Monday, October 30, 2017

Thursday, October 26, 2017
RYNVX big change in market cap !
Updates in BLUE - RYNVX market capitalization increased $321Mil from Tuesday Oct 24th to today, Oct 26th.
RYNVX - Rydex Nova Fund Investor Class (Long Fund)
RYNVX - Rydex Nova Fund Investor Class (Long Fund)
RYNVX Oct 24,2017 $92,20Mil & Oct 26,2017 $413.07Mil
$413.07Mil is the largest market capitalization in RYNVX since March 2009.
Note The RYNVX increased $321Mil in two trading days. That is a whopping increase of $321Mil in market
capitalization. This could be interpreted as some were fearful of not
being long in this Nova Fund. Is that fear bearish for the market? It
is
possible that this "could" have come from some stock market newsletter
writer advising their clients to buy.
When this Long Fund has big changes in market
cap in a very short time frame,
not very sure if this will have any influence in the market. We will keep an eye on this and let you know what happens.
Large & small dollar amounts of market cap in the RYNVX long fund displays Greed & Fear in the market...
Keep following JustSignals using Twitter, @StockTwits or Follow By Email.
Just submit your email address in the box on the Blog homepage
This has been posted for Educational Purposes Only. Do your own work and consult with Professionals before making any investment decisions.
Past performance is not indicative of future results
Tuesday, October 17, 2017
chart: SPY vs Hi - Lo 10DMA
The SPY vs Hi - Lo 10DMA as of today's close

This chart should be self explanatory.
Keep following JustSignals using Twitter, @StockTwits or Follow By Email. Just submit your email address in the box on the Blog homepage. This has been posted for Educational Purposes Only. Do your own work and consult with Professionals before making any investment decisions. Past performance is not indicative of future results

This chart should be self explanatory.
Keep following JustSignals using Twitter, @StockTwits or Follow By Email. Just submit your email address in the box on the Blog homepage. This has been posted for Educational Purposes Only. Do your own work and consult with Professionals before making any investment decisions. Past performance is not indicative of future results
chart: Goldman Sachs Says....
 |
| Courtesy of Jesse Columbo, @TheBubbleBubble |
Keep following JustSignals using Twitter, @StockTwits or Follow By Email. Just submit your email address in the box on the Blog homepage. This has been posted for Educational Purposes Only. Do your own work and consult with Professionals before making any investment decisions. Past performance is not indicative of future results
Wednesday, October 11, 2017
chart: McClellan Summation
Below are two McClellan Summation (MS) charts as shown by Worden Bros charting service.
The top chart is from 2009-2017. Note that the area highlighted in yellow was enlarged in the lower chart.
Most of the time the MS goes between either -2000 & +2000 or -3000 & +3000. Occasionally it does reach extreme readings of -4000 & +4000.
As you can see in 2009 & in 2016 the MS did go below -4000 and in 2012-2013 it went between -3000 & +3000.
But, starting in 2015 the MS did not get above +500 even while the stock market did trade higher and was making new ATH's.
It is currently at a triple top area at or just under +500.
If the MS cannot get past +500 decisively, then a correction of some sort may be on the horizon.
Also, a chart of stocks above their 200DMA have had lower tops over the last 18 months.
This also confirms the current MS chart.
At the very least, if the MS stalls here as it did the last two times, highlighted in yellow & circled in red in the lower chart, you can see that the market went into a sideways trading pattern,
By Investopedia
The index is calculated by adding the current day's McClellan Oscillator to the previous day's Summation Index, making it a cumulative measure of movements. Given that it is based on past prices, it is a lagging indicator.
Usually, a small number of stocks making large gains characterizes a weakening bull market. This gives the perception that the overall market is healthy, but in reality it isn't, as rising prices are being driven by a small number of stocks. Conversely, when a bear market is still declining, but a smaller amount of stocks are declining, an end to the bear market may be near. The McClellan Oscillator — which the Summation index is based on — is calculated using 19- and 39-day exponential moving averages, which avoids applying large gains and declines of a few stocks to the whole market, thus it indicates the trend itself, as well as the strength of it.
Keep following JustSignals using Twitter, @StockTwits or Follow By Email. Just submit your email address in the box on the Blog homepage. This has been posted for Educational Purposes Only. Do your own work and consult with Professionals before making any investment decisions. Past performance is not indicative of future results
The top chart is from 2009-2017. Note that the area highlighted in yellow was enlarged in the lower chart.
Most of the time the MS goes between either -2000 & +2000 or -3000 & +3000. Occasionally it does reach extreme readings of -4000 & +4000.
As you can see in 2009 & in 2016 the MS did go below -4000 and in 2012-2013 it went between -3000 & +3000.
But, starting in 2015 the MS did not get above +500 even while the stock market did trade higher and was making new ATH's.
It is currently at a triple top area at or just under +500.
If the MS cannot get past +500 decisively, then a correction of some sort may be on the horizon.
Also, a chart of stocks above their 200DMA have had lower tops over the last 18 months.
This also confirms the current MS chart.
At the very least, if the MS stalls here as it did the last two times, highlighted in yellow & circled in red in the lower chart, you can see that the market went into a sideways trading pattern,
 |
| Courtesy of Worden Bros. |
 |
| Courtesy or Worden Bros. |
By Investopedia
The index is calculated by adding the current day's McClellan Oscillator to the previous day's Summation Index, making it a cumulative measure of movements. Given that it is based on past prices, it is a lagging indicator.
Usually, a small number of stocks making large gains characterizes a weakening bull market. This gives the perception that the overall market is healthy, but in reality it isn't, as rising prices are being driven by a small number of stocks. Conversely, when a bear market is still declining, but a smaller amount of stocks are declining, an end to the bear market may be near. The McClellan Oscillator — which the Summation index is based on — is calculated using 19- and 39-day exponential moving averages, which avoids applying large gains and declines of a few stocks to the whole market, thus it indicates the trend itself, as well as the strength of it.
Interpretation
(By StockCharts.com Chart School)
The Summation Index rises when the McClellan Oscillator is positive and falls when the McClellan Oscillator is negative. Extended positive numbers in the McClellan Oscillator cause the Summation Index to trend higher. Conversely, extended negative readings cause the Summation Index to trend lower.
Because of its cumulative nature, the Summation Index is a slower version of the McClellan Oscillator. The index crosses the zero line fewer times, forms divergences less often and produces fewer signals in general. Whereas the McClellan Oscillator can be used for short-term and medium-term timing, the Summation Index is generally used for medium-term and long-term timing.
There are three basic signals. First, the Summation Index generally favors the bulls when positive and the bears when negative. Second, chartists can look for bullish and bearish divergences to anticipate reversals. Third, chartists can identify directional movement to define a bullish or bearish bias.
The Summation Index rises when the McClellan Oscillator is positive and falls when the McClellan Oscillator is negative. Extended positive numbers in the McClellan Oscillator cause the Summation Index to trend higher. Conversely, extended negative readings cause the Summation Index to trend lower.
Because of its cumulative nature, the Summation Index is a slower version of the McClellan Oscillator. The index crosses the zero line fewer times, forms divergences less often and produces fewer signals in general. Whereas the McClellan Oscillator can be used for short-term and medium-term timing, the Summation Index is generally used for medium-term and long-term timing.
There are three basic signals. First, the Summation Index generally favors the bulls when positive and the bears when negative. Second, chartists can look for bullish and bearish divergences to anticipate reversals. Third, chartists can identify directional movement to define a bullish or bearish bias.
Keep following JustSignals using Twitter, @StockTwits or Follow By Email. Just submit your email address in the box on the Blog homepage. This has been posted for Educational Purposes Only. Do your own work and consult with Professionals before making any investment decisions. Past performance is not indicative of future results
Sunday, October 8, 2017
Picasso Cycle Update
In this update only the date/s will be mentioned with an "H" for high and a "L" for low.
The chart amplitude can and will be misleading at times.
In addition, it is the date/s that is most important rather than if that date is a projected high or low.
One important reason is because in some cases a date may invert and the "H" or "L" may not mean anything.
A low may actually turn out to be a high and visa versa.
Also it is very important that other tools always be used to confirm any potential ST Cycle Date.
Picasso Dates, always +/-
Mar 3-14 H - high occurred on Mar 15th
Mar 20-28 L - possible low occurring in this time frame - Low occurred on March 27th
Apr 10-13 H (+/-) - high occurred on April 5th & later on Apr 10th
Apr 4/21-24 L (+/-) - lows occurred on April 13th, 18th, 19th, 21st
Apr 28- May8 H - highs on April 26th & May 9th...only 3 day correction, then grinded higher
May 21 L - actual low 2 TD's early on May18
May 25-June 1 H - June 1 hit a high then grinded marginally higher to June 9
June 10-19 L - actual low June 16
June 28-July3 H - June 26th high near this time frame - DJIA high, so far, July 3rd
July 7-14 L - low was July 11
July 19-28 H - So far, SPY 7/27 H, QQQ 7/27 H, IWM 7/25 H
Aug 4-12 L - low was SPY 8/11
Aug 8/18-23 H - highs were made on 8/16 & 8/22
Aug 30-Sept 7 L - a low was made on 8/29
Sept 13-22 H - a high was made on 9/14
Sept 29-Oct 5 L - a low was made on 9/25 (left translation of this cycle date)
Oct 11-17 H
Comments:
Long term indicators appear positive, so far. Negative divergence on many indicators were broken very late last year and so they now suggest further upside. So, if pullbacks develop into the Picasso cycle date lows and daily indicators are OverSold, it may present a good buying opportunity.
So far this forecast came to pass. The August low was accurate.
In addition, the LT cycles suggested a low in August +/-, which we had, & a high in November +/-.
Always remember to confirm cycle dates with your or your professional investment advisors analysis.
The LT Cycle low suggested for August was shallow. The DJIA high was 22,179 and the DJIA low was 21,600. This was a 2.6% correction. Not much, but, it was a correction as forecasted nevertheless.
Keep following JustSignals using Twitter, @StockTwits or Follow By Email. Just submit your email address in the box on the Blog homepage. This has been posted for Educational Purposes Only. Do your own work and consult with Professionals before making any investment decisions. Past performance is not indicative of future results
The chart amplitude can and will be misleading at times.
In addition, it is the date/s that is most important rather than if that date is a projected high or low.
One important reason is because in some cases a date may invert and the "H" or "L" may not mean anything.
A low may actually turn out to be a high and visa versa.
Also it is very important that other tools always be used to confirm any potential ST Cycle Date.
Picasso Dates, always +/-
Mar 3-14 H - high occurred on Mar 15th
Mar 20-28 L - possible low occurring in this time frame - Low occurred on March 27th
Apr 10-13 H (+/-) - high occurred on April 5th & later on Apr 10th
Apr 4/21-24 L (+/-) - lows occurred on April 13th, 18th, 19th, 21st
Apr 28- May8 H - highs on April 26th & May 9th...only 3 day correction, then grinded higher
May 21 L - actual low 2 TD's early on May18
May 25-June 1 H - June 1 hit a high then grinded marginally higher to June 9
June 10-19 L - actual low June 16
June 28-July3 H - June 26th high near this time frame - DJIA high, so far, July 3rd
July 7-14 L - low was July 11
July 19-28 H - So far, SPY 7/27 H, QQQ 7/27 H, IWM 7/25 H
Aug 4-12 L - low was SPY 8/11
Aug 8/18-23 H - highs were made on 8/16 & 8/22
Aug 30-Sept 7 L - a low was made on 8/29
Sept 13-22 H - a high was made on 9/14
Sept 29-Oct 5 L - a low was made on 9/25 (left translation of this cycle date)
Oct 11-17 H
Comments:
Long term indicators appear positive, so far. Negative divergence on many indicators were broken very late last year and so they now suggest further upside. So, if pullbacks develop into the Picasso cycle date lows and daily indicators are OverSold, it may present a good buying opportunity.
So far this forecast came to pass. The August low was accurate.
In addition, the LT cycles suggested a low in August +/-, which we had, & a high in November +/-.
Always remember to confirm cycle dates with your or your professional investment advisors analysis.
The LT Cycle low suggested for August was shallow. The DJIA high was 22,179 and the DJIA low was 21,600. This was a 2.6% correction. Not much, but, it was a correction as forecasted nevertheless.
Keep following JustSignals using Twitter, @StockTwits or Follow By Email. Just submit your email address in the box on the Blog homepage. This has been posted for Educational Purposes Only. Do your own work and consult with Professionals before making any investment decisions. Past performance is not indicative of future results
Are We There Yet?
On March 29,2017 we discussed the Zweig Breadth Thrust. A copy of that post is below. The interesting part of that post is when you look at the DJIA projection. If you apply the average gain of the ZBT to the low at Nov 2016 you hit a forecast of 22,500 11 months later in Oct 2017. That is about where we are right now. That forecast when applied to the S&P500 is 2,625 and we are not at that point yet. But, we are not too far away. Maybe if we take an average of the DJIA and the S&P500 we will get a better forecast. In any event, between the ZBT and the Long Term Picasso Cycles forecast of a potential November 2017 high, the caution light is on to watch your charts carefully for any intermediate term sell signals on the weekly and monthly charts.
The last ZBT that we noted, occurred starting Nov 8,2016.
If we apply the the average gain of 24.6% to the average length of 11 months we get:
DJIA Nov. 2016 18,000 --->22,500 forecast 11 months later in Oct.2017
S&P500 Nov. 2016 2,100 ---> 2.625 forecast 11 months later in Oct.2017
Will the stock market possibly continue straight up until Oct, 2017? We doubt it. In fact, the LT Picasso Cycle dates suggest an April high +/-, an August low +/- and then a Nov high +/-. This last high in Nov is very close to the ZBT average forecast high in Oct. 2017.
Keep following JustSignals using Twitter, @StockTwits or Follow By Email. Just submit your email address in the box on the Blog homepage. This has been posted for Educational Purposes Only. Do your own work and consult with Professionals before making any investment decisions. Past performance is not indicative of future results
Wednesday, March 29, 2017
Zweig Breadth Thrust
The Breadth Thrust indicator is a market momentum
indicator. It was developed by Dr. Martin Zweig. The Breadth Thrust is
calculated by dividing a 10-day exponential moving average of the number
of advancing issues, by the number of advancing plus declining issues.
Interpretation
A
"Breadth Thrust" occurs when, during a 10-day period, the Breadth
Thrust indicator rises from below 40% to above 61.5%. A "Thrust"
indicates that the stock market has rapidly changed from an oversold
condition to one of strength, but has not yet become overbought.
According
to Dr. Zweig, there have only been fourteen Breadth Thrusts since 1945 (as of the date of the original printing of this article ???).
The average gain following these fourteen Thrusts was 24.6% in an
average time-frame of eleven months. Dr. Zweig also points out that most
bull markets begin with a Breadth Thrust.
The last ZBT that we noted, occurred starting Nov 8,2016.
If we apply the the average gain of 24.6% to the average length of 11 months we get:
DJIA Nov. 2016 18,000 --->22,500 forecast 11 months later in Oct.2017
S&P500 Nov. 2016 2,100 ---> 2.625 forecast 11 months later in Oct.2017
Will the stock market possibly continue straight up until Oct, 2017? We doubt it. In fact, the LT Picasso Cycle dates suggest an April high +/-, an August low +/- and then a Nov high +/-. This last high in Nov is very close to the ZBT average forecast high in Oct. 2017.
Keep following JustSignals using Twitter, @StockTwits or Follow By Email. Just submit your email address in the box on the Blog homepage. This has been posted for Educational Purposes Only. Do your own work and consult with Professionals before making any investment decisions. Past performance is not indicative of future results
Monday, September 11, 2017
Picasso Cycle Update
In this update only the date/s will be mentioned with an "H" for high and a "L" for low.
The chart amplitude can and will be misleading at times.
In addition, it is the date/s that is most important rather than if that date is a projected high or low.
One important reason is because in some cases a date may invert and the "H" or "L" may not mean anything.
A low may actually turn out to be a high and visa versa.
Also it is very important that other tools always be used to confirm any potential ST Cycle Date.
Picasso Dates, always +/-
Mar 3-14 H - high occurred on Mar 15th
Mar 20-28 L - possible low occurring in this time frame - Low occurred on March 27th
Apr 10-13 H (+/-) - high occurred on April 5th & later on Apr 10th
Apr 4/21-24 L (+/-) - lows occurred on April 13th, 18th, 19th, 21st
Apr 28- May8 H - highs on April 26th & May 9th...only 3 day correction, then grinded higher
May 21 L - actual low 2 TD's early on May18
May 25-June 1 H - June 1 hit a high then grinded marginally higher to June 9
June 10-19 L - actual low June 16
June 28-July3 H - June 26th high near this time frame - DJIA high, so far, July 3rd
July 7-14 L - low was July 11
July 19-28 H - So far, SPY 7/27 H, QQQ 7/27 H, IWM 7/25 H
Aug 4-12 L - low was SPY 8/11
Aug 8/18-23 H - highs were made on 8/16 & 8/22
Aug 30-Sept 7 L - a low was made on 8/29
Sept 13-22 H
Sept 29-Oct 5 L
Comments
The Picasso Cycle dates have been working well lately. Let it continue !
Long term indicators appear positive, so far. Negative divergence on many indicators were broken very late last year and so they now suggest further upside. So, if pullbacks develop into the Picasso cycle date lows and daily indicators are OverSold, it may present a good buying opportunity.
So far this forecast came to pass. The August low was accurate. Although September does not have a good reputation and the Picasso Cycle dates are forecasting a low Sept 29-Oct 5 +/-.
In addition, the LT cycles suggested a low in August +/-, which we had, & a high in November +/-.
Always remember to confirm cycle dates with your or your professional investment advisors analysis.
The LT Cycle low suggested for August was shallow. The DJIA high was 22,179 and the DJIA low was 21,600. This was a 2.6% correction. Not much, but, it was a correction as forecasted nevertheless.
Keep following JustSignals using Twitter, @StockTwits or Follow By Email. Just submit your email address in the box on the Blog homepage. This has been posted for Educational Purposes Only. Do your own work and consult with Professionals before making any investment decisions. Past performance is not indicative of future results
The chart amplitude can and will be misleading at times.
In addition, it is the date/s that is most important rather than if that date is a projected high or low.
One important reason is because in some cases a date may invert and the "H" or "L" may not mean anything.
A low may actually turn out to be a high and visa versa.
Also it is very important that other tools always be used to confirm any potential ST Cycle Date.
Picasso Dates, always +/-
Mar 3-14 H - high occurred on Mar 15th
Mar 20-28 L - possible low occurring in this time frame - Low occurred on March 27th
Apr 10-13 H (+/-) - high occurred on April 5th & later on Apr 10th
Apr 4/21-24 L (+/-) - lows occurred on April 13th, 18th, 19th, 21st
Apr 28- May8 H - highs on April 26th & May 9th...only 3 day correction, then grinded higher
May 21 L - actual low 2 TD's early on May18
May 25-June 1 H - June 1 hit a high then grinded marginally higher to June 9
June 10-19 L - actual low June 16
June 28-July3 H - June 26th high near this time frame - DJIA high, so far, July 3rd
July 7-14 L - low was July 11
July 19-28 H - So far, SPY 7/27 H, QQQ 7/27 H, IWM 7/25 H
Aug 4-12 L - low was SPY 8/11
Aug 8/18-23 H - highs were made on 8/16 & 8/22
Aug 30-Sept 7 L - a low was made on 8/29
Sept 13-22 H
Sept 29-Oct 5 L
Comments
The Picasso Cycle dates have been working well lately. Let it continue !
Long term indicators appear positive, so far. Negative divergence on many indicators were broken very late last year and so they now suggest further upside. So, if pullbacks develop into the Picasso cycle date lows and daily indicators are OverSold, it may present a good buying opportunity.
So far this forecast came to pass. The August low was accurate. Although September does not have a good reputation and the Picasso Cycle dates are forecasting a low Sept 29-Oct 5 +/-.
In addition, the LT cycles suggested a low in August +/-, which we had, & a high in November +/-.
Always remember to confirm cycle dates with your or your professional investment advisors analysis.
The LT Cycle low suggested for August was shallow. The DJIA high was 22,179 and the DJIA low was 21,600. This was a 2.6% correction. Not much, but, it was a correction as forecasted nevertheless.
Keep following JustSignals using Twitter, @StockTwits or Follow By Email. Just submit your email address in the box on the Blog homepage. This has been posted for Educational Purposes Only. Do your own work and consult with Professionals before making any investment decisions. Past performance is not indicative of future results
Wednesday, September 6, 2017
chart: q and CAPE, valuations
 |
| Courtesy of Andrew Smithers/Smithers & Co |
Yup, second highest CAPE and third highest q in 100 years.
Keep following JustSignals using Twitter, @StockTwits or Follow By Email. Just submit your email address in the box on the Blog homepage. This has been posted for Educational Purposes Only. Do your own work and consult with Professionals before making any investment decisions. Past performance is not indicative of future results
AAII Bullish % predicts...
Dr. Aubie Baltin CFA, CTA, CFP, PhD., Palm Beach Gardens, FL 33418, and writer of the market newsletter, UNCOMMON COMMON SENSE, once wrote that the stock market tends to rally for approx 3-6 months when the AAII bullish reading is under 25.
Recent dates when the AAII Bullish % was less than 25.00
June 9,2011 24.40 - Sell off into Aug 2011 before continuing higher
May 16,2012 23.60 - Market continued higher
July 18,2012 22.20 - Market continued higher
April 10,2013 19.30 - Market continued higher
June 10,2015 20.00 - Sell off into Aug 2015, but same level 5 months later
July 1,2015 22.60 - Sell off into Aug 2015, but same level 4 months later
July 29,2015 21.10 - Sell off into Aug 2015, but same level 3 months later
Aug 5,2015 24.30 - Sell off into Aug 2015, but same level 3 months later
Dec 16,2015 23.90 - Sell off into Jan 2016, but higher level 4-6 months later
May 4,2016 22.30 - Market continued higher
Sep 21,2016 24.83 - Market continued higher
May 17,2017 23.90 - Market continued higher
Aug 30,2017 25.00 ???
Bullish %'s below 25.00% suggests that the market may rally 3-6 months out. If Aubie Baltin is correct again, then it certainly agrees with the suggestions of the Picasso Long Term Cycles of a November high (*Aug plus 3 months).
JustSignals posts for the Long Term Cycles have been suggesting:
Long term indicators appear positive, so far.
The LT cycles now suggest a high in November +/-.
Always remember to confirm cycle dates with your or your professional investment advisors analysis.
*Also note that a change in trend took place in the month of August in 2010, 2011, 2013, 2014, 2015 and 2016. Will it happen again in 2017 as Picasso Long Term Cycles suggest?
Keep following JustSignals using Twitter, @StockTwits or Follow By Email. Just submit your email address in the box on the Blog homepage. This has been posted for Educational Purposes Only. Do your own work and consult with Professionals before making any investment decisions. Past performance is not indicative of future results
Recent dates when the AAII Bullish % was less than 25.00
June 9,2011 24.40 - Sell off into Aug 2011 before continuing higher
May 16,2012 23.60 - Market continued higher
July 18,2012 22.20 - Market continued higher
April 10,2013 19.30 - Market continued higher
June 10,2015 20.00 - Sell off into Aug 2015, but same level 5 months later
July 1,2015 22.60 - Sell off into Aug 2015, but same level 4 months later
July 29,2015 21.10 - Sell off into Aug 2015, but same level 3 months later
Aug 5,2015 24.30 - Sell off into Aug 2015, but same level 3 months later
Dec 16,2015 23.90 - Sell off into Jan 2016, but higher level 4-6 months later
May 4,2016 22.30 - Market continued higher
Sep 21,2016 24.83 - Market continued higher
May 17,2017 23.90 - Market continued higher
Aug 30,2017 25.00 ???
Bullish %'s below 25.00% suggests that the market may rally 3-6 months out. If Aubie Baltin is correct again, then it certainly agrees with the suggestions of the Picasso Long Term Cycles of a November high (*Aug plus 3 months).
JustSignals posts for the Long Term Cycles have been suggesting:
Long term indicators appear positive, so far.
The LT cycles now suggest a high in November +/-.
Always remember to confirm cycle dates with your or your professional investment advisors analysis.
*Also note that a change in trend took place in the month of August in 2010, 2011, 2013, 2014, 2015 and 2016. Will it happen again in 2017 as Picasso Long Term Cycles suggest?
Keep following JustSignals using Twitter, @StockTwits or Follow By Email. Just submit your email address in the box on the Blog homepage. This has been posted for Educational Purposes Only. Do your own work and consult with Professionals before making any investment decisions. Past performance is not indicative of future results
Is GE a Predictor of the Market?
GE is the only original stock left in the DJIA.
By Investopedia
The Dow Jones Industrial Average was created in 1896 by Charles Dow and originally consisted of 12 companies: American Cotton Oil, American Sugar, American Tobacco, Chicago Gas, Distilling & Cattle Feeding, General Electric, Laclede Gas, National Lead, North American, Tennessee Coal and Iron, U.S. Leather pfd. and U.S. Rubber. At the time, these companies represented each sector of the market and thus the Dow Jones illustrated the overall performance of the market in the United States.
At the end of a recession created by the collapse of Philadelphia and Reading Railroads in 1893, these companies represented the stronghold of the United States. Even with the trouble from the railroads, coal remained the dominant fuel for transportation, while gas and electric were growing in demand. Crops were a major export and source of revenue for the economy, while also providing sustenance.
As the country's industrial age came to a close, electricity became the dominant energy source that led to numerous technological advancements. The economy shifted toward providing more consumer goods. With these changes, all but General Electric ceased to exist. In 1929, the Dow Jones was expanded to include the 30-company list known as of August 2014. The 30 companies have changed over the years, but the index still represents a wide section of the U.S. market. However, with so few companies listed in the index, it can only truly reflect about a quarter of the overall market. Even with this small list, the DJIA is still able to accurately reflect trends across the broad market.
By Investopedia
The Dow Jones Industrial Average was created in 1896 by Charles Dow and originally consisted of 12 companies: American Cotton Oil, American Sugar, American Tobacco, Chicago Gas, Distilling & Cattle Feeding, General Electric, Laclede Gas, National Lead, North American, Tennessee Coal and Iron, U.S. Leather pfd. and U.S. Rubber. At the time, these companies represented each sector of the market and thus the Dow Jones illustrated the overall performance of the market in the United States.
At the end of a recession created by the collapse of Philadelphia and Reading Railroads in 1893, these companies represented the stronghold of the United States. Even with the trouble from the railroads, coal remained the dominant fuel for transportation, while gas and electric were growing in demand. Crops were a major export and source of revenue for the economy, while also providing sustenance.
As the country's industrial age came to a close, electricity became the dominant energy source that led to numerous technological advancements. The economy shifted toward providing more consumer goods. With these changes, all but General Electric ceased to exist. In 1929, the Dow Jones was expanded to include the 30-company list known as of August 2014. The 30 companies have changed over the years, but the index still represents a wide section of the U.S. market. However, with so few companies listed in the index, it can only truly reflect about a quarter of the overall market. Even with this small list, the DJIA is still able to accurately reflect trends across the broad market.
 | ||
| Courtesy of Worden Bros. |
Thursday, August 31, 2017
Picasso Cycle Update
In this update only the date/s will be mentioned with an "H" for high and a "L" for low.
The chart amplitude can and will be misleading at times.
In addition, it is the date/s that is most important rather than if that date is a projected high or low.
One important reason is because in some cases a date may invert and the "H" or "L" may not mean anything.
A low may actually turn out to be a high and visa versa.
Also it is very important that other tools always be used to confirm any potential ST Cycle Date.
Picasso Dates, always +/-
Mar 3-14 H - high occurred on Mar 15th
Mar 20-28 L - possible low occurring in this time frame - Low occurred on March 27th
Apr 10-13 H (+/-) - high occurred on April 5th & later on Apr 10th
Apr 4/21-24 L (+/-) - lows occurred on April 13th, 18th, 19th, 21st
Apr 28- May8 H - highs on April 26th & May 9th...only 3 day correction, then grinded higher
May 21 L - actual low 2 TD's early on May18
May 25-June 1 H - June 1 hit a high then grinded marginally higher to June 9
June 10-19 L - actual low June 16
June 28-July3 H - June 26th high near this time frame - DJIA high, so far, July 3rd
July 7-14 L - low was July 11
July 19-28 H - So far, SPY 7/27 H, QQQ 7/27 H, IWM 7/25 H
Aug 4-12 L - low was SPY 8/11
Aug 8/18-23 H - highs were made on 8/16 & 8/22
Aug 30-Sept 7 L - so far, a low was made on 8/29
Sept 13-22 H
Comments
See new comments in blue above and below.
Long term indicators appear positive, so far. Negative divergence on many indicators were broken very late last year and so they now suggest further upside. So, if pullbacks develop into the Picasso cycle date lows and daily indicators are OverSold, it may present a good buying opportunity.
In addition, the LT cycles still suggest a low in August +/- & a high in November +/-.
Always remember to confirm cycle dates with your or your professional investment advisors analysis.
The LT Cycle low suggested for August was shallow. The DJIA high was 22,179 and the DJIA low was 21,600. This was a 2.6% correction. Not much, but, it was a correction as forecasted nevertheless.
Keep following JustSignals using Twitter, @StockTwits or Follow By Email. Just submit your email address in the box on the Blog homepage. This has been posted for Educational Purposes Only. Do your own work and consult with Professionals before making any investment decisions. Past performance is not indicative of future results
The chart amplitude can and will be misleading at times.
In addition, it is the date/s that is most important rather than if that date is a projected high or low.
One important reason is because in some cases a date may invert and the "H" or "L" may not mean anything.
A low may actually turn out to be a high and visa versa.
Also it is very important that other tools always be used to confirm any potential ST Cycle Date.
Picasso Dates, always +/-
Mar 3-14 H - high occurred on Mar 15th
Mar 20-28 L - possible low occurring in this time frame - Low occurred on March 27th
Apr 10-13 H (+/-) - high occurred on April 5th & later on Apr 10th
Apr 4/21-24 L (+/-) - lows occurred on April 13th, 18th, 19th, 21st
Apr 28- May8 H - highs on April 26th & May 9th...only 3 day correction, then grinded higher
May 21 L - actual low 2 TD's early on May18
May 25-June 1 H - June 1 hit a high then grinded marginally higher to June 9
June 10-19 L - actual low June 16
June 28-July3 H - June 26th high near this time frame - DJIA high, so far, July 3rd
July 7-14 L - low was July 11
July 19-28 H - So far, SPY 7/27 H, QQQ 7/27 H, IWM 7/25 H
Aug 4-12 L - low was SPY 8/11
Aug 8/18-23 H - highs were made on 8/16 & 8/22
Aug 30-Sept 7 L - so far, a low was made on 8/29
Sept 13-22 H
Comments
See new comments in blue above and below.
Long term indicators appear positive, so far. Negative divergence on many indicators were broken very late last year and so they now suggest further upside. So, if pullbacks develop into the Picasso cycle date lows and daily indicators are OverSold, it may present a good buying opportunity.
In addition, the LT cycles still suggest a low in August +/- & a high in November +/-.
Always remember to confirm cycle dates with your or your professional investment advisors analysis.
The LT Cycle low suggested for August was shallow. The DJIA high was 22,179 and the DJIA low was 21,600. This was a 2.6% correction. Not much, but, it was a correction as forecasted nevertheless.
Keep following JustSignals using Twitter, @StockTwits or Follow By Email. Just submit your email address in the box on the Blog homepage. This has been posted for Educational Purposes Only. Do your own work and consult with Professionals before making any investment decisions. Past performance is not indicative of future results
Wednesday, August 23, 2017
charts: Fear & Greed Index
 |
| Courtesy of CNN/Money |
 |
| Courtesy of CNN/Money |
Watch your indicators carefully for buy signals. We should be closer to a low than to a high with a Fear & Greed Index reading below 20.
Keep following JustSignals using Twitter, @StockTwits or Follow By Email. Just submit your email address in the box on the Blog homepage. This has been posted for Educational Purposes Only. Do your own work and consult with Professionals before making any investment decisions. Past performance is not indicative of future results
Tuesday, August 15, 2017
Picasso Cycle Update
In this update only the date/s will be mentioned with an "H" for high and a "L" for low.
The chart amplitude can and will be misleading at times.
In addition, it is the date/s that is most important rather than if that date is a projected high or low.
One important reason is because in some cases a date may invert and the "H" or "L" may not mean anything.
A low may actually turn out to be a high and visa versa.
Also it is very important that other tools always be used to confirm any potential ST Cycle Date.
Picasso Dates, always +/-
Mar 3-14 H - high occurred on Mar 15th
Mar 20-28 L - possible low occurring in this time frame - Low occurred on March 27th
Apr 10-13 H (+/-) - high occurred on April 5th & later on Apr 10th
Apr 4/21-24 L (+/-) - lows occurred on April 13th, 18th, 19th, 21st
Apr 28- May8 H - highs on April 26th & May 9th...only 3 day correction, then grinded higher
May 21 L - actual low 2 TD's early on May18
May 25-June 1 H - June 1 hit a high then grinded marginally higher to June 9
June 10-19 L - actual low June 16
June 28-July3 H - June 26th high near this time frame - DJIA high, so far, July 3rd
July 7-14 L - low was July 11
July 19-28 H - So far, SPY 7/27 H, QQQ 7/27 H, IWM 7/25 H
Aug 4-12 L - low was SPY 8/11
Aug 8/18-23 H
Aug 30-Sept 7 L
Comments
See new comments in blue above and below.
Long term indicators appear positive, so far. Negative divergence on many indicators were broken very late last year and so they now suggest further upside. So, if pullbacks develop into the Picasso cycle date lows and daily indicators are OverSold, it may present a good buying opportunity.
In addition, the LT cycles still suggest a low in August +/- & a high in November +/-.
Always remember to confirm cycle dates with your or your professional investment advisors analysis.
Keep following JustSignals using Twitter, @StockTwits or Follow By Email. Just submit your email address in the box on the Blog homepage. This has been posted for Educational Purposes Only. Do your own work and consult with Professionals before making any investment decisions. Past performance is not indicative of future results
The chart amplitude can and will be misleading at times.
In addition, it is the date/s that is most important rather than if that date is a projected high or low.
One important reason is because in some cases a date may invert and the "H" or "L" may not mean anything.
A low may actually turn out to be a high and visa versa.
Also it is very important that other tools always be used to confirm any potential ST Cycle Date.
Picasso Dates, always +/-
Mar 3-14 H - high occurred on Mar 15th
Mar 20-28 L - possible low occurring in this time frame - Low occurred on March 27th
Apr 10-13 H (+/-) - high occurred on April 5th & later on Apr 10th
Apr 4/21-24 L (+/-) - lows occurred on April 13th, 18th, 19th, 21st
Apr 28- May8 H - highs on April 26th & May 9th...only 3 day correction, then grinded higher
May 21 L - actual low 2 TD's early on May18
May 25-June 1 H - June 1 hit a high then grinded marginally higher to June 9
June 10-19 L - actual low June 16
June 28-July3 H - June 26th high near this time frame - DJIA high, so far, July 3rd
July 7-14 L - low was July 11
July 19-28 H - So far, SPY 7/27 H, QQQ 7/27 H, IWM 7/25 H
Aug 4-12 L - low was SPY 8/11
Aug 8/18-23 H
Aug 30-Sept 7 L
Comments
See new comments in blue above and below.
Long term indicators appear positive, so far. Negative divergence on many indicators were broken very late last year and so they now suggest further upside. So, if pullbacks develop into the Picasso cycle date lows and daily indicators are OverSold, it may present a good buying opportunity.
In addition, the LT cycles still suggest a low in August +/- & a high in November +/-.
Always remember to confirm cycle dates with your or your professional investment advisors analysis.
Keep following JustSignals using Twitter, @StockTwits or Follow By Email. Just submit your email address in the box on the Blog homepage. This has been posted for Educational Purposes Only. Do your own work and consult with Professionals before making any investment decisions. Past performance is not indicative of future results
chart: SPY vs Hi - Lo 10DMA
Posted on June 22,2017
The 10 Day Hi-Lo has created a triangle pattern.
When the SPY makes a higher high while the 10 day Hi-Lo starts to drop, be on watch. In the past divergences appear at most turns in the market. At the very least, the 10 day Hi-Lo develops lower highs and lower lows at or near tops and higher highs and higher lows at or near bottoms.
But here we have a triangle pattern and right now there is no indication if it will break out of this pattern up or down. But it is getting closer to the vertex. So a break out should happen very soon.
The SPY vs Hi - Lo 10DMA as of today's close
 It finally broke out of the triangle pattern. Let's see if it has the power to pull the market down in August. There has been some mixed breadth lately, so there is a chance. Also the Picasso cycles still suggests a pullback in August.
Keep following JustSignals using Twitter, @StockTwits or Follow By Email.
Just submit your email address in the box on the Blog homepage
This has been posted for Educational Purposes Only. Do your own work and consult with Professionals before making any investment decisions.
Past performance is not indicative of future results
The 10 Day Hi-Lo has created a triangle pattern.
When the SPY makes a higher high while the 10 day Hi-Lo starts to drop, be on watch. In the past divergences appear at most turns in the market. At the very least, the 10 day Hi-Lo develops lower highs and lower lows at or near tops and higher highs and higher lows at or near bottoms.
But here we have a triangle pattern and right now there is no indication if it will break out of this pattern up or down. But it is getting closer to the vertex. So a break out should happen very soon.
The SPY vs Hi - Lo 10DMA as of today's close

Keep following JustSignals using Twitter, @StockTwits or Follow By Email.
Just submit your email address in the box on the Blog homepage
This has been posted for Educational Purposes Only. Do your own work and consult with Professionals before making any investment decisions.
Past performance is not indicative of future results
Friday, August 4, 2017
Picasso Cycle Update
In this update only the date/s will be mentioned with an "H" for high and a "L" for low.
The chart amplitude can and will be misleading at times.
In addition, it is the date/s that is most important rather than if that date is a projected high or low.
One important reason is because in some cases a date may invert and the "H" or "L" may not mean anything.
A low may actually turn out to be a high and visa versa.
Also it is very important that other tools always be used to confirm any potential ST Cycle Date.
Picasso Dates, always +/-
Mar 3-14 H - high occurred on Mar 15th
Mar 20-28 L - possible low occurring in this time frame - Low occurred on March 27th
Apr 10-13 H (+/-) - high occurred on April 5th & later on Apr 10th
Apr 4/21-24 L (+/-) - lows occurred on April 13th, 18th, 19th, 21st
Apr 28- May8 H - highs on April 26th & May 9th...only 3 day correction, then grinded higher
May 21 L - actual low 2 TD's early on May18
May 25-June 1 H - June 1 hit a high then grinded marginally higher to June 9
June 10-19 L - actual low June 16
June 28-July3 H - June 26th high near this time frame - DJIA high, so far, July 3rd
July 7-14 L - low was July 11
July 19-28 H - So far, SPY 7/27 H, QQQ 7/27 H, IWM 7/25 H
Aug 4-12 L
Aug 8/18-23 H
Comments
See new comments in blue above and below.
Long term indicators appear positive, so far. Negative divergence on many indicators were broken very late last year and so they now suggest further upside. So, if pullbacks develop into the Picasso cycle date lows and daily indicators are OverSold, it may present a good buying opportunity.
In addition, the LT cycles still suggest a low in August +/- & a high in November +/-.
Always remember to confirm cycle dates with your or your professional investment advisors analysis.
Keep following JustSignals using Twitter, @StockTwits or Follow By Email. Just submit your email address in the box on the Blog homepage. This has been posted for Educational Purposes Only. Do your own work and consult with Professionals before making any investment decisions. Past performance is not indicative of future results
The chart amplitude can and will be misleading at times.
In addition, it is the date/s that is most important rather than if that date is a projected high or low.
One important reason is because in some cases a date may invert and the "H" or "L" may not mean anything.
A low may actually turn out to be a high and visa versa.
Also it is very important that other tools always be used to confirm any potential ST Cycle Date.
Picasso Dates, always +/-
Mar 3-14 H - high occurred on Mar 15th
Mar 20-28 L - possible low occurring in this time frame - Low occurred on March 27th
Apr 10-13 H (+/-) - high occurred on April 5th & later on Apr 10th
Apr 4/21-24 L (+/-) - lows occurred on April 13th, 18th, 19th, 21st
Apr 28- May8 H - highs on April 26th & May 9th...only 3 day correction, then grinded higher
May 21 L - actual low 2 TD's early on May18
May 25-June 1 H - June 1 hit a high then grinded marginally higher to June 9
June 10-19 L - actual low June 16
June 28-July3 H - June 26th high near this time frame - DJIA high, so far, July 3rd
July 7-14 L - low was July 11
July 19-28 H - So far, SPY 7/27 H, QQQ 7/27 H, IWM 7/25 H
Aug 4-12 L
Aug 8/18-23 H
Comments
See new comments in blue above and below.
Long term indicators appear positive, so far. Negative divergence on many indicators were broken very late last year and so they now suggest further upside. So, if pullbacks develop into the Picasso cycle date lows and daily indicators are OverSold, it may present a good buying opportunity.
In addition, the LT cycles still suggest a low in August +/- & a high in November +/-.
Always remember to confirm cycle dates with your or your professional investment advisors analysis.
Keep following JustSignals using Twitter, @StockTwits or Follow By Email. Just submit your email address in the box on the Blog homepage. This has been posted for Educational Purposes Only. Do your own work and consult with Professionals before making any investment decisions. Past performance is not indicative of future results
Monday, July 24, 2017
chart: Market Valuations
 |
| Courtesy of dshort.com |
The yellow area is now the window we are in which represents the 1929 high and the 2000 high.
Keep following JustSignals using Twitter, @StockTwits or Follow By Email. Just submit your email address in the box on the Blog homepage. This has been posted for Educational Purposes Only. Do your own work and consult with Professionals before making any investment decisions. Past performance is not indicative of future results
chart: DIA is OB ?
 |
| Courtesy of ChaikinAnalytics.com |
During this rise in price the yellow arrows show a falling Chaikin Money Flow and a falling Relative Strength. RS also started falling below 0.00 or neutral. This is not what you want to see if you think the ETF is going to continue rising. You would want to see more confirmation of a rising ETF, that is, more green in both the Chaikin Money Flow & Relative Strength.
Since the Advance Decline Line (ADL) is still making new highs, it would be nice to see a "Pause that Refreshes" here and then another push up to new highs again. Over the last 100years +/-, the stock market has not topped out making new ATHs along with the ADL making new ATHs. They don't usually do it together. The ADL usually tops out first and then the stock market in a negative divergence pattern.
The Picasso Cycle Dates, posted July 14th, suggested a high July 19-28. The Longer Term Picasso Cycle Dates suggest a pause in August and a high later in the year. This would be great if it all fell into place this nicely.
Keep following JustSignals using Twitter, @StockTwits or Follow By Email. Just submit your email address in the box on the Blog homepage. This has been posted for Educational Purposes Only. Do your own work and consult with Professionals before making any investment decisions. Past performance is not indicative of future results
Tuesday, July 18, 2017
charts:Indices YTD Performance
 |
| Courtesy of ChaikinAnalytics.com |
 |
| Courtesy of ChaikinAnalytics.com |
 |
| Courtesy of ChaikinAnalytics.com |
Keep following JustSignals using Twitter, @StockTwits or Follow By Email. Just submit your email address in the box on the Blog homepage. This has been posted for Educational Purposes Only. Do your own work and consult with Professionals before making any investment decisions. Past performance is not indicative of future results
Charts: Correction Coming? Or the Pause that Refreshes?
 |
| Courtesy of ChaikinAnalytics.com |
 |
| Courtesy of ChaikinAnalytics.com |
 |
| Courtesy of ChaikinAnalytics.com |
 |
| Courtesy of ChaikinAnalytics.com |
 |
| Courtesy of ChaikinAnalytics.com |
 |
| Courtesy of ChaikinAnalytics.com |
 |
| Courtesy of ChaikinAnalytics.com |
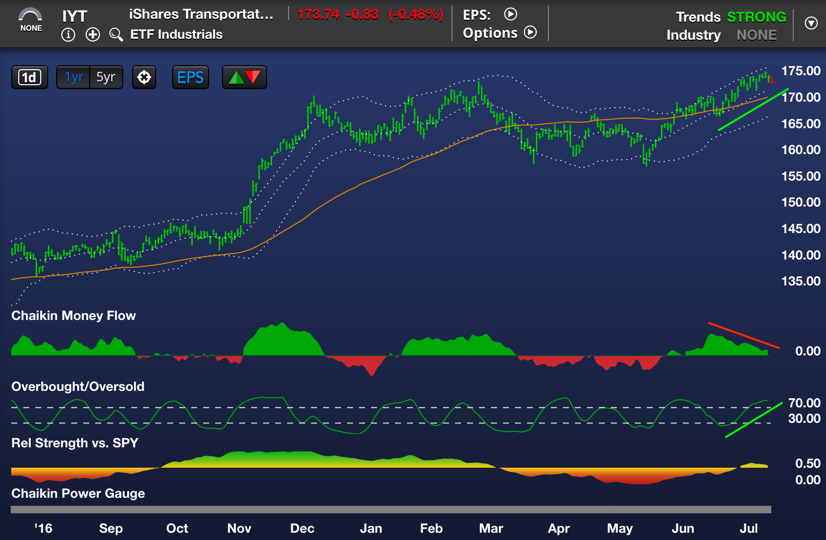
Lots of negative divergence. Is a correction coming or is this the pause that refreshes?
Keep following JustSignals using Twitter, @StockTwits or Follow By Email. Just submit your email address in the box on the Blog homepage. This has been posted for Educational Purposes Only. Do your own work and consult with Professionals before making any investment decisions. Past performance is not indicative of future results
Subscribe to:
Posts (Atom)