Thursday, June 30, 2016

% of DJIA Stocks Above 10DMA

Courtesy of IndexIndicators.com

Keep following JustSignals using Twitter, @StockTwits or Follow By Email. 

Just submit your email address in the box on the Blog homepage
This has been posted for Educational Purposes Only.   Do your own work and consult with Professionals before making any investment decisions.  
Past performance is not indicative of future results

Picasso cycle dates review

How well did Picasso do so far ?


Note that Picasso cycle dates are based on 365 calendar days and not trading days.  So it does not know from Holidays, Saturdays & Sundays.  In addition, cycles dates are always given +/-.
As always,
Amplitude in this chart has no correlation with the amplitude in the stock market, as you can see.


Keep following JustSignals using Twitter, @StockTwits or Follow By Email. 
Just submit your email address in the box on the Blog homepage
This has been posted for Educational Purposes Only.   Do your own work and consult with Professionals before making any investment decisions.  
Past performance is not indicative of future results


Wednesday, June 29, 2016

Major Cycle Low in Gold coming

May 19, 2016

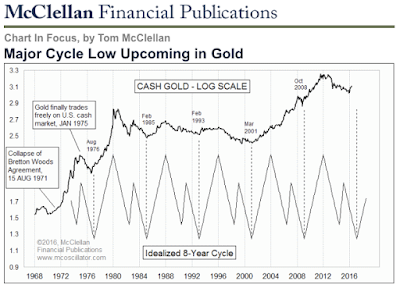
There is a major cycle low looming for gold prices.  Ideally it should arrive as a price low in late 2016.  But based on history, it could arrive anytime between August 2016 and March 2017, and still fit within the normal tolerance.
Defining a normal tolerance for gold’s 8-year cycle is a pretty iffy proposition.  We have only 5 prior examples to go by, and while they cover a period of over 40 years, anyone who ever studied statistics knows that n<30 is problematic.  If you want to wait until n=30 before believing in this cycle, then you only have to wait until the year 2215.
If you are willing to accept the message from fewer iterations, then this week’s chart has some interesting insights to offer.  A few years ago I constructed this idealized 8-year cycle pattern, and featured it in our newsletter.  The one leg up, 3-waves down pattern has “worked” ever since gold finally started trading freely in 1975, with one major exception.  From 2001 to 2009, the normal “left translation” flipped to a more bullish right translation mode.  Aside from that one strong uptrending period, gold’s price pattern has matched this artificial pattern pretty well. 
The relevance of that insight for the current period is that the next major 8-year cycle bottom is due this autumn.  Ideally it should be due in February 2017, but another tool suggests that late 2016 is more likely to see the arrival of that bottom. 

There is a dominant 13-1/2 month cycle in gold prices.  The next major cycle low is ideally due in October 2016, but gold regularly makes bottoms plus or minus a month from the ideal cycle bottoms.  So this is not a tool that will allow anyone to reasonably pencil in a hard date for when the cycle low is due.  
Still, an autumn 2016 bottom for the 13-1/2 month cycle fits well with the idea of a major 8-year cycle low due in late 2016 to early 2017.  One additional insight from the 13-1/2 month cycle is that we have already seen “right translation” of the price pattern versus this cycle, and that one piece of information conveys bullish portents for the likelihood of a higher price high for gold in 2017, once we get past the upcoming big cycle low. 
Bottom Line: We have two major long-term cycles, both calling for an important bottom in gold prices in late 2016.  That’s a big deal.  The two are independent of each other, and their confluence in calling for a bottom later this year has strong implications.  Gold prices ought to be expected to drop downward into that cycle low, but more importantly we should expect a big uptrend to commence out of that major cycle bottom.  It will be hard for gold bugs to be patient and wait for that major cycle low to arrive, but the long term cycles say that the ensuing rally should be worth the wait. 
Tom McClellan
Editor, The McClellan Market Report
www.mcoscillator.com
(253) 581-4889 

Keep following JustSignals using Twitter, @StockTwits or Follow By Email. 
Just submit your email address in the box on the Blog homepage
This has been posted for Educational Purposes Only.   Do your own work and consult with Professionals before making any investment decisions.  
Past performance is not indicative of future results

Forecasting Gold

June 24, 2016

With the Brexit vote now decided, a lot of attention has turned to gold as a supposed “safety” asset.  Most traders who lived through the big decline of 1980s do not think of gold as a “safe” asset.  And the message of this week’s chart is that expectations for a big gold price rally from here may be misplaced. 
A year ago, I wrote here about the role of uranium prices as a leading indication for what gold prices will do later.  A 7-month lead time seems to be ideal for getting the best fit between the two plots. 
The recent rise (since late 2015) in gold prices is a bit of a delayed reaction to the rise in uranium prices.  But looking ahead from now, we can see that the recent drop in uranium prices is foretelling a drop in gold prices over about the next 6 months. 
Gold can sometimes ignore uranium’s message, as we saw in 2009-2010 when gold trended higher in spite of uranium having trended downward.  That was an adjustment process following uranium’s big spike up move in 2007, and uranium’s 2008-10 downtrend was a process of unwinding those excesses.  So yes, there are exceptions to this model working perfectly.
Right now, we do not appear to have a bubble in uranium prices to suggest that something is amiss in the model.  So I am expecting that gold should be able to stay with the program, and head downward into late 2016.  Such a move would also fit well with the expectation from the 8-year cycle in gold prices. 
Tom McClellan
Editor, The McClellan Market Report
www.mcoscillator.com
(253) 581-4889

Keep following JustSignals using Twitter, @StockTwits or Follow By Email. 
Just submit your email address in the box on the Blog homepage
This has been posted for Educational Purposes Only.   Do your own work and consult with Professionals before making any investment decisions.  
Past performance is not indicative of future results
Monday, June 27, 2016

SPY weekly chart

Courtesy of eSignal


Note in this chart the vertical green lines.  They have been placed at times when the bottom indicator has been at the red horizontal line.  This has been at or near an over sold condition.  Click on the chart and look at each one.


Keep following JustSignals using Twitter, @StockTwits or Follow By Email. 
Just submit your email address in the box on the Blog homepage
This has been posted for Educational Purposes Only.   Do your own work and consult with Professionals before making any investment decisions.  
Past performance is not indicative of future results

Earl & Earl2

Buy when others are fearful

by Danny / LunaticTrader
Markets fell on the brexit referendum result and fear seems to be all over the place in what looks like a kind of Stockholm syndrome. But what most commentary failed to mention is that the FTSE 100 was actually up 1.9% for the week. EU stock markets took the biggest beating, so it looks like the market is saying that leaving the EU is better than staying in.
Let's have a look at the Nasdaq chart:
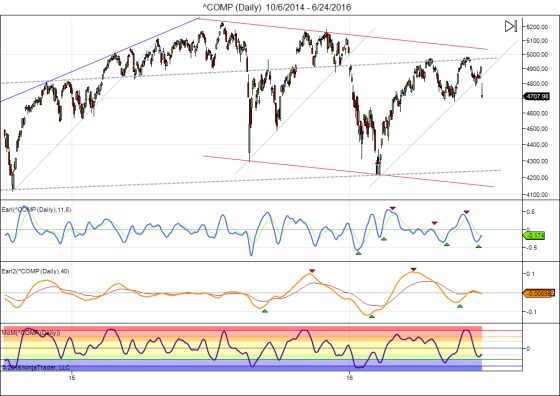
^COMP (Daily)  10_6_2014 - 6_24_2016
The Nasdaq is back to its May lows. It could easily fall a bit further and test the 4600 level. But we have started a new lunar green period and the Earl and MoM indicators have turned up already. So I would look for volatility to subside as overblown fears calm down. Panic selling will dry up and then stocks will start trading with a positive bias.
As I said during the Greek crisis, stand ready to buy any country that finds a way to leave the EU or the Euro. Britain is now very likely to be the first country to take that step, so I would use this to buy FTSE on any weakness. The long term monthly chart for the UK stock market happens to be very interesting:
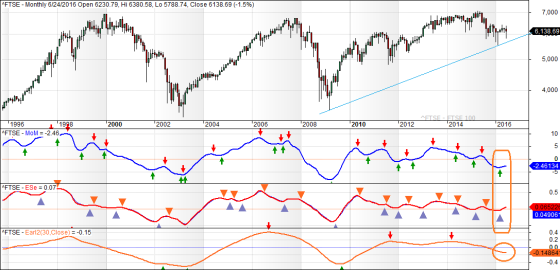
FTSE
The FTSE stays well above its February lows and that's quite remarkable given the hysterical comments that are being made. The smart money must be buying.
Two of my three main indicators have turned up a few months ago and the slower Earl 2 is ready to follow suit. That is a favorable long term setup. A breakout above the multi-decade resistance around 7000 is possible in the medium term, and that would open the door for a further rally. Buy when others are fearful.
Keep following JustSignals using Twitter, @StockTwits or Follow By Email. 
Just submit your email address in the box on the Blog homepage
This has been posted for Educational Purposes Only.   Do your own work and consult with Professionals before making any investment decisions.  
Past performance is not indicative of future results

Testing 6 year support

Global Leading Indicators, testing 6-year rising support channels

Courtesy of Chris Kimble

Monday, June 13, 2016

Picasso ST cycles


Amplitude in this chart has no correlation with the amplitude in the stock market.


Keep following JustSignals using Twitter, @StockTwits or Follow By Email. 
Just submit your email address in the box on the Blog homepage
This has been posted for Educational Purposes Only.   Do your own work and consult with Professionals before making any investment decisions.  
Past performance is not indicative of future results

Earl & Earl 2

 By Danny / LunaticTrader.com
 Markets keep hesitating and a pullback seems to be starting. Nothing unexpected.
Meanwhile the official media keeps rehashing the "Brexit fear" meme ad nauseam, and that theme will probably dominate the financial news for the next few weeks. Whenever the FTSE 100 or Pound is down it gets conveniently blamed on "Brexit fear". And whenever they are up something else gets the credit. Meanwhile they forget to mention that British Pound and stocks are simply flat since March, just like most other markets in the world.
To fear or not to fear, that's always the question... Remember Buffett's "be greedy when other are fearful". With all that fear talk, as if the sky will come down if a country leaves the EU, this must be a great time to be greedy...
Let's have a look at the Nasdaq chart:

Courtesy of Danny at LunaticTrader.com
Stocks have turned lower after bumping into overhead resistance just below 5000. More downside action looks likely for the coming weeks, as both the Earl and MoM indicators are dropping fast and nowhere near bottom territory.
The 4800 level is the first reasonable support level, but it remains to be seen if that will halt the slide. Maybe it won't if desperate eurocrats keep turning on the fear faucets. And that could set us up with a great buying opportunity towards the end of the month. So I would be patient here.
Keep following JustSignals using Twitter, @StockTwits or Follow By Email. 
Just submit your email address in the box on the Blog homepage
This has been posted for Educational Purposes Only.   Do your own work and consult with Professionals before making any investment decisions.  
Past performance is not indicative of future results
Friday, June 3, 2016

chart: SPY daily & 240min UPDATE

Courtesy of eSignal
Above is the daily SPY.  Also yesterday afternoon the market made gains that was able to complete 5 waves up on the daily chart.  This is in sync with the ST cycles forecast of a 6/2 high to possibly be followed by a 6/17,18 low.  As noted yesterday, June is usually a weak month for the stock market and if there is a June sell off and most of the indicators still look good and are not falling apart, we may have more to go on the upside later in the year.

Courtesy of eSignal
Above is the 240min SPY.  Also after yesterdays late afternoon rally the 240min SPY chart wave count was relabeled and 5 waves were completed on this chart also.  There was a major relabeling effort in this chart, one that was not so obvious yesterday.  But as you read in yesterdays "Summary":

"Summary: There seems to be more positive action than negative action.  Looking to see both charts complete their respective 5 waves up before a counter trend move begins."

This happened a little quicker than originally thought, but it happened.

Markets do not go straight up or straight down, so keep watching for blog updates and Twitter updates for more information.

Keep following JustSignals using Twitter, @StockTwits or Follow By Email. 
Just submit your email address in the box on the Blog homepage
This has been posted for Educational Purposes Only.   Do your own work and consult with Professionals before making any investment decisions.  
Past performance is not indicative of future results
Thursday, June 2, 2016

charts: SPY 240min & daily

Courtesy of eSignal
Above is the SPY daily chart.  The price bars got stopped at the overhead resistance blue trend line at 210.87 and the price bars are still blue and have not changed to red yet.  The MACD has not given a crossover buy, yet.  But it is close.  The buyers, blue ADX line, are still in control.  The bottom oscillator is headed to an OS area in the green highlight.
June is usually a weak month for the stock market and if there is a sell off and most of the indicators still look good and are not falling apart, we may have more to go on the upside.

Courtesy of eSignal
Above is the SPY 240min chart.  The price bars are still blue and are sitting on a support trend line.  MACD has not given a cross over sell yet and the blue line looks like it may still want to try and turn up a little.  Maybe enough to get a completed 5 waves up in price.  The bottom oscillator did reach the first bottom line in the over sold area.  But reaching the red line would be better.   Usually as long as the MACD is still positive, the first over sold line maybe all it needs to keep going up. 

Summary: There seems to be more positive action than negative action.  Looking to see both charts complete thier respective 5 waves up before a counter trend move begins.

Keep following JustSignals using Twitter, @StockTwits or Follow By Email. 
Just submit your email address in the box on the Blog homepage
This has been posted for Educational Purposes Only.   Do your own work and consult with Professionals before making any investment decisions.  
Past performance is not indicative of future results