LunaticTrader
Markets
are going through another significant downswing. Volatility has been
high compared to what traders got used to in 2017. This was of course
inevitable, and it is something I was watching as an indication that we
are getting into the late stages of a multi-year bear market. See: Updated long term scenarios and charts.
So, what's next? Here is the current Nasdaq chart:
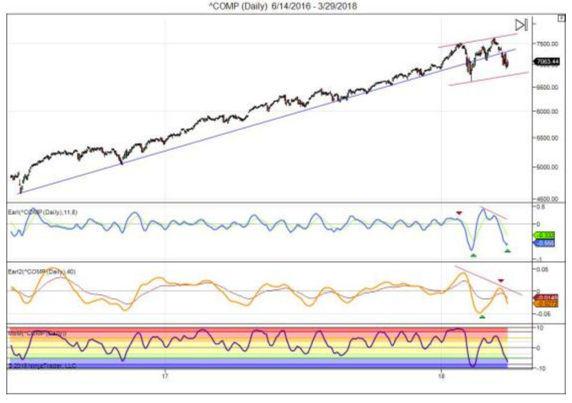 |
| Courtesy of LunaticTrader |
The
long term blue trend line in Nasdaq is clearly broken. But the Nasdaq
is still in a higher highs and higher lows sequence, so it's too early
to declare the end of the bull market in this index.
The Earl (blue line) is turning up from a major low. The slower Earl2 (orange line) is still dropping fast, but well into bottom territory. The MoM indicator has fallen into the blue pessimistic zone (<-5), where major buying opportunities are usually found. Once the MoM turns back up we will have a nice setup to do some cautious buying here.
The Earl (blue line) is turning up from a major low. The slower Earl2 (orange line) is still dropping fast, but well into bottom territory. The MoM indicator has fallen into the blue pessimistic zone (<-5), where major buying opportunities are usually found. Once the MoM turns back up we will have a nice setup to do some cautious buying here.
If
major indexes drop below their February lows, then more bearish
scenarios would gain traction. That wouldn't rule out new record highs
later on, but it would probably push them further back in time.
Keep following JustSignals using Twitter, @StockTwits or Follow By Email. Just submit your email address in the box on the Blog homepage.
This has been posted for Educational Purposes Only.
Do your own work and consult with Professionals before making any investment decisions.
Past performance is not indicative of future results.
This has been posted for Educational Purposes Only.
Do your own work and consult with Professionals before making any investment decisions.
Past performance is not indicative of future results.
No comments:
Post a Comment
Note: Only a member of this blog may post a comment.