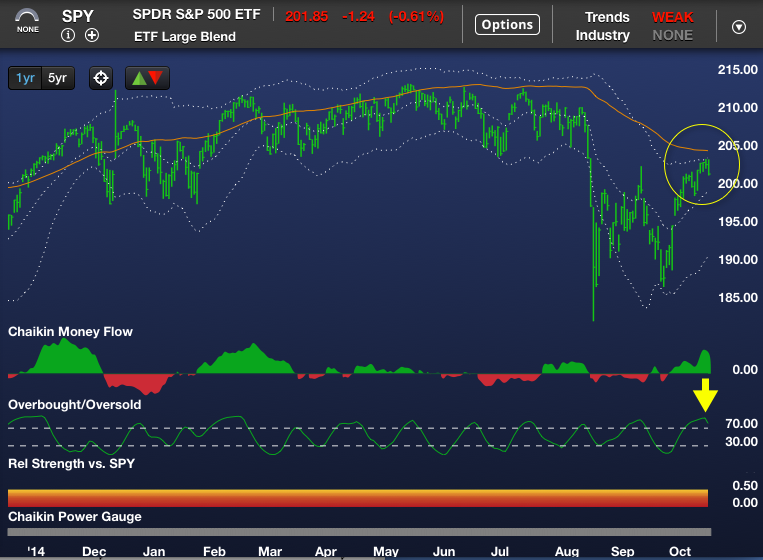
The price in each chart is below Chaikin's proprietary 200DMA and near or at the top of the white trading bands, Trend is weak, Relative Strength indicators circled in yellow are weak and the OverBought/OverSold indicator just turned down as indicated by the yellow arrow.
(Note that the Relative Strength indicator in the SPY chart should be ignored because the Relative Strength indicator in all charts is calculated relative to the SPY. That is why the Relative Strength indicator on the SPY chart is a solid straight line.)
As of this writing, the Pre-market DJIA futures are up +135.00. This is not a surprise as the next cycle date is Oct 26th +/-. This was posted on Oct 9th. Cycle dates will be updated soon. The Oct 26th date will be changed to Oct 23-26+/-. A turn "may" occur in the late October early November time frame. More on this later.
There are warning signs popping up so be aware and watch your indicators carefully for any changes.
 |
| Courtesy of Chaikin Analytics |
 |
| Courtesy of Chaikin Analytics |
 |
| Courtesy of Chaikin Analytics |
 |
| Courtesy of Chaikin Analytics |
 |
| Courtesy of Chaikin Analytics |
Keep following JustSignals using Twitter, @StockTwits or Follow By Email.
Just submit your email address in the box on the Blog homepage
This has been posted for Educational Purposes Only. Do your own work and consult with Professionals before making any investment decisions.
Past performance is not indicative of future results
No comments:
Post a Comment
Note: Only a member of this blog may post a comment.