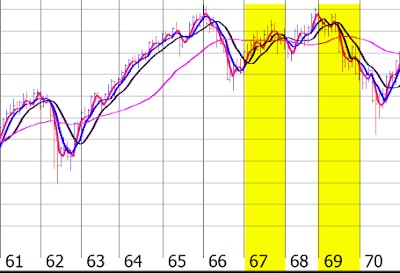
The above charts start from 1915 and go to the current year 2016.
Each decade is shown separately. As you can see the 7th and 9th years have been highlighted in yellow.
The reason for this was to show that highs have been made in the 7th and 9th years of a decade.
In some cases a high was made in the 6th year as in 1916-17, 1946, 1956-57, 1966 and 1976-77.
Since the current bull market which started in 2009 is 7 1/2 years mature, it is likely that 2016-17 & 2019 may put a damper on the bull and give way to another bear market.
Keep following JustSignals using Twitter, @StockTwits or Follow By Email.
Just submit your email address in the box on the Blog homepageThis has been posted for Educational Purposes Only. Do your own work and consult with Professionals before making any investment decisions.
Past performance is not indicative of future results


No comments:
Post a Comment
Note: Only a member of this blog may post a comment.