Tuesday, May 31, 2016

chart: % of DJIA above 10DMA

Courtesy of IndexIndicators.com

Keep following JustSignals using Twitter, @StockTwits or Follow By Email. 
Just submit your email address in the box on the Blog homepage
This has been posted for Educational Purposes Only.   Do your own work and consult with Professionals before making any investment decisions.  
Past performance is not indicative of future results

charts: Fear & Greed

Courtesy of CNN.Money
Courtesy of CNN/Money

Keep following JustSignals using Twitter, @StockTwits or Follow By Email. 

Just submit your email address in the box on the Blog homepage
This has been posted for Educational Purposes Only.   Do your own work and consult with Professionals before making any investment decisions.  
Past performance is not indicative of future results

Friday, May 20, 2016

chart: $SPX:$VIX

Courtesy of StockCharts.com
Most OS areas are highlighted in yellow. 

Keep following JustSignals using Twitter, @StockTwits or Follow By Email. 

Just submit your email address in the box on the Blog homepage
This has been posted for Educational Purposes Only.   Do your own work and consult with Professionals before making any investment decisions.  
Past performance is not indicative of future results

Thursday, May 19, 2016

Combining the "W" pattern and the last year of a 2 term President

Courtesy of McClellan Financial Publications
After staring at all of these charts, hidden in the chart of Two Term Presidents, above, was a "W" pattern, highlighted in yellow, that was discussed by John P. Hussman, Ph.D., in the February 15, 2016 article, Warning with a Capital "W".

This article can be found at   http://www.hussmanfunds.com/wmc/wmc160215.htm

As you can see below, in the weekly SPY chart, is also a "W" pattern at the end of a long 7 year bull market that started March 2009.
In the John P. Hussman article were two other charts with a "W" pattern, 1987 & 1929, shown at the bottom of this post.

Courtesy of eSignal
JustSignals posts the turn dates for short term and intermediate/long term cycles.  The short term cycles have been recently posted as Picasso Dates.  Let's discuss the intermediate/long term cycles for a moment.  The two periods that are likely for some kind of a high, lower or higher than where we are now, is May/June 2016 & Nov/Dec 2016.  This is solely based on intermediate & long term cycles.  
Other hints come from the Escape Velocity, Strong Summation Index by McClellan Financial Publication and the AAII sentiment numbers, all of which have been posted here as well. 
One thing is true and that is, what ever the market does, the caution light is on.  Be careful and use stops!

Article information:
Link    http://www.hussmanfunds.com/wmc/wmc160215.htm
February 15, 2016 Warning with a Capital "W"
By John P. Hussman, Ph.D.

The following two charts are from the above mentioned article which is highly worth reading!
 

Courtesy of HussmanFunds.com

Courtesy of HussmanFunds.com
Another interesting observation is that a potential 29+/- year cycle "may" be operative.  
1929(crash)+29=1958(Eisenhower recession)+29=1987(crash)+29=2016(???)

In order to calculate the correct ending date you must start with the correct beginning date !


Keep following JustSignals using Twitter, @StockTwits or Follow By Email. 
Just submit your email address in the box on the Blog homepage
This has been posted for Educational Purposes Only.   Do your own work and consult with Professionals before making any investment decisions.  
Past performance is not indicative of future results

Wednesday, May 18, 2016

Picasso dates Updated

From the post on Wednesday, May 4,2016

Picasso's dates are always +/-

April 7 to 12 - low             Low hit during Picasso dates
April 20 to 25 - high          High hit during Picasso dates
April 29 to May 2 - low      Lows hit during Picasso dates
May *7 to 17 - high          High hit during Picasso dates
 
(May 30 - low)      (Potential quick moves between the May 7 to 17 high and  
(June 2 - high)           the June 17 low)

June *17 - low

Intermediate cycles - Late April early *May high & *June +/- low

* = potentially important dates


Keep following JustSignals using Twitter, @StockTwits or Follow By Email. 
Just submit your email address in the box on the Blog homepage
This has been posted for Educational Purposes Only.   Do your own work and consult with Professionals before making any investment decisions.  
Past performance is not indicative of future results

Gold vs NIRP

By Andrew Walker - May 17, 2016

The Motley Fool

The gold rally
Soros is betting on Barrick because he believes gold is headed higher.
What’s the scoop?
The guru is concerned that China’s economy is setting up for a hard landing, and that could provide added fuel to global deflationary pressures.
Many countries are already moving toward negative interest rates, and this tends to be positive for gold because people will opt to buy the precious metal instead of paying the bank to hold their money. Gold is always knocked for not providing any return, but no return suddenly looks pretty good when interest rates turn negative.

Keep following JustSignals using Twitter, @StockTwits or Follow By Email. 
Just submit your email address in the box on the Blog homepage
This has been posted for Educational Purposes Only.   Do your own work and consult with Professionals before making any investment decisions.  
Past performance is not indicative of future results

Monday, May 16, 2016

Strong Summation Index

Courtesy of McClellan Financial Publications

May 13, 2016

The strong breadth numbers which produced a new all-time high for the A-D Line this year also produced a really high reading for the Ratio-Adjusted Summation Index (RASI), the highest since 2012.  And that action conveys to us the promise of higher price highs.
But it does not preclude a meaningful correction first, and we appear to be in the midst of that right now.  The RASI is falling, as it typically does during corrective periods. 
The basic point is that after a correction like we saw earlier this year, with the Feb. 11, 2016 price bottom, the RASI shows a strong market by rising well up above the +500 level.  When the RASI can do that, we like to say that it signals that the new rally has demonstrated

                                   “escape velocity”

 like a rocket trying to leave Earth’s gravity, and thus the price averages do not need to fall back down to test the prior low.  More importantly, while the RASI may top out and lead to a corrective period, we are promised a higher high after that correction. 
Exactly when that higher high comes, and how much higher, are not points revealed by the RASI.  We have to turn to other tools to divine those. But the uptrend should be expected to continue until such time as there is a failure by the RASI to climb back up above the +500 level after dropping below it
Tom McClellan
Editor, The McClellan Market Report
www.mcoscillator.com
(253) 581-4889 

See the JustSignals post on  “escape velocity”  
Link     http://justsignals.blogspot.com/2016/03/2016-bear-or-bull.html

Based on the information from Tom McClellan in the article above and the JustSignals post on "Escape Velocity" with the charts of each of the years in which an escape thrust was seen since 1970, both indicate that a positive market should be seen after a mid year pullback.

Keep following JustSignals using Twitter, @StockTwits or Follow By Email. 
Just submit your email address in the box on the Blog homepage
This has been posted for Educational Purposes Only.   Do your own work and consult with Professionals before making any investment decisions.  
Past performance is not indicative of future results


AAPL, What Does Warren Buffett See?

Warren Buffett buys stake in Apple


Is Warren Buffett calling a bottom in Apple's stock price?
 
Berkshire Hathaway (BRKA), the conglomerate run by Buffett, disclosed in a regulatory filing Monday that it purchased more than 9.8 million shares in Apple (AAPL, Tech30) during the first quarter. It marks Berkshire's first investment in Apple.
Berkshire acquired its position at an average price of about $109 a share.
But the value of that investment, originally worth around $1.1 billion, has already dropped significantly. Investors have been worried about slowing demand for iPhones after Apple reported disappointing earnings last month.
Apple's stock price has since fallen to just above $90, meaning that Berkshire's stake in Apple is now worth about $888 million.
Shares of Apple are down 14% so far in 2016, making it -- along with Intel (INTC, Tech30) and Goldman Sachs (GS) -- one of the worst stocks in the Dow this year.
Apple competitor Alphabet (GOOGL, Tech30)-- the parent company of Google and owner of the Android mobile operating system -- recently overtook Apple as the world's most valuable company as well.
Related: Buffett backing a group bidding for Yahoo
Still, shares of Apple, which hit a new 52-week low on Thursday, rose more than 3% in early trading Monday on the news of Berkshire's stake. That move vaulted Apple back ahead of Alphabet in the market cap race.
The Apple purchase is the second big tech investment by Berkshire, which has been steadily adding to its stake in IBM (IBM, Tech30) during the past few years.
  
JustSignals Comments


In the AAPL chart above,  the vertical yellow highlights indicate where AAPL was oversold over the last two years.  AAPL during this period did rally subsequent to these periods.

Courtesy of ChaikinAnalytics.com
In the AAPL chart above the short term is also oversold.  But, at the time of this writting AAPL was up about 3% after the news of Warren Buffet was in the news.
But this chart indicates weakness in AAPL.   So what does Warren Buffet know that we don't?

Buffet is known as a value investor.
Buffet buys on weakness and sells into strength.
JustSignals will be keeping an eye on this stock.

Keep following JustSignals using Twitter, @StockTwits or Follow By Email. 
Just submit your email address in the box on the Blog homepage
This has been posted for Educational Purposes Only.   Do your own work and consult with Professionals before making any investment decisions.  
Past performance is not indicative of future results


Earl & Earl2

By Danny / LunaticTrader.com

Stocks tried to rally for a few days, but fell back just as quickly. The pullback has been very orderly so far, and after 4 weeks of downside action a bottom may be near. Of course it is also possible that more downside action is in the pipeline. Let's have a look at the Nasdaq chart:
Courtesy of LunaticTrader.com
 The 4600-4700 area is a probably bottom zone if this market is setting up for a further climb. A drop below 4600 would look much more bearish. Four weeks of downside action has brought the slower Earl2 index (orange line) into bottom territory, but it is not turning up yet. The faster Earl (blue line) and the MoM have bottomed already.
We may see another rally attempt this week, but I think it will take another dip below 4700 to allow the Earl2 to paint a proper low. That would give us a nice setup going into June.
So, I would wait at this point and when the next lunar green period starts towards the end of May we could have a favorable situation to enter longs. Patience pays in this kind of situations and we may be moving towards a "buy in May" while nearly everybody will be chanting the classic "sell in May".
Be ready for everything, then you can't be surprised by anything.

Keep following JustSignals using Twitter, @StockTwits or Follow By Email. 
Just submit your email address in the box on the Blog homepage
This has been posted for Educational Purposes Only.   Do your own work and consult with Professionals before making any investment decisions.  
Past performance is not indicative of future results

Tuesday, May 10, 2016

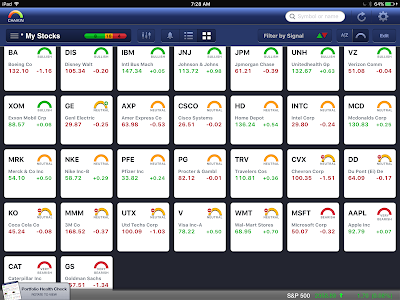
Chaikin's Dow30 power ratings

Courtesy of ChaikinAnalytics.com
ChaikinAnalytics.com uses the following power ratings:
very bullish
bullish
neutral+
neutral
neutral-
bearish
very bearish

NOTE that in the Dow30 list above, as of this mornings report based on yesterdays close, there are no Dow30 stocks rated "very bullish" and when we are within 4% of the all time high.  If we were in a true bull market, we would expect to see some Dow30 stocks rated "very bullish" and in fact less rated "very bearish" & "bearish" as there are 2 of each in the above list.

Keep following JustSignals using Twitter, @StockTwits or Follow By Email. 
Just submit your email address in the box on the Blog homepage
This has been posted for Educational Purposes Only.   Do your own work and consult with Professionals before making any investment decisions.  
Past performance is not indicative of future results


Monday, May 9, 2016

Earl & Earl2

The Following Opinions  By Danny of @LunaticTrader

Stocks have started a long awaited pullback. The bearish divergences we mentioned a few weeks ago have finally taken their toll on the market rally. Now the question becomes how deep the pullback will be and when it will end.Let's have a look at the S&P 500 chart.

Courtesy of @LunaticTrader
 The S&P has lost about 50 points since its April highs. That's still a very mild pullback given the size of the rally that preceded it. But it has been enough to pull the Earl indicator into bottom territory and ready to turn up again. That lines up nicely with the LT wave for May, which suggests a strong period over the coming 10 days, so a rebound may start sooner rather than later. The slower Earl2 (orange line) is still headed lower, so if we get a bounce in the next week or two it will probably be followed by a second leg down.
My current base scenario is for a rally attempt that may go as high as 2100, but probably no new high for the year. Another pullback in late May or June would create a good setup going into summer. But we will first see what happens.

Keep following JustSignals using Twitter, @StockTwits or Follow By Email. 
Just submit your email address in the box on the Blog homepage
This has been posted for Educational Purposes Only.   Do your own work and consult with Professionals before making any investment decisions.  
Past performance is not indicative of future results

GLD vs SLV

Keep following JustSignals using Twitter, @StockTwits or Follow By Email. 
Just submit your email address in the box on the Blog homepage
This has been posted for Educational Purposes Only.   Do your own work and consult with Professionals before making any investment decisions.  
Past performance is not indicative of future results

Friday, May 6, 2016

We are "Here"

Courtesy of McClellan Financial Publications
Chart In Focus, by Tom McClellan
 A May-November Relationship

 May 06, 2016

The big mantra the past two weeks is the old Wall Street saying, “Sell in May and go away”.  That became an old saying for mostly good reasons.  But what many do not realize is that it works differently in election years. 
Where the May to November period is most reliably weak is in the first two years of a presidential term.  It is even an up year during most 3rd years, except that the big crash of October 1987 pulled down the average in a big way. 
During election years from 1936 to 2012, the period from May 1 to Oct. 30 has actually been up 2.7%.  That’s not great, but it’s not nothing either.  But we can split the data down even further (at the risk of endangering sample size) to say that it matters whether there is a first term or second term president in office.  
If there is an incumbent president in office, running for reelection, then the May 1 to Oct. 31 period is up on average by 4.7%.  This makes sense, because an incumbent who is running for reelection will seek to spin the news in his favor, running victory laps for all of the problems he supposedly solved over the past 3-1/2 years.  Investors tend to respond well to a flood of good news, making them more optimistic about the future generally, and thus about their investments.
But if a second term president is in office, he has less motivation to go around telling everyone what a spiffy job he has been doing, since he cannot get reelected.  So investors are then faced with the certainty of getting an unknown quantity as the new president, and investors hate the risk of the unknown.  So during election year in a 2nd presidential term, the May 1 to Oct. 31 period averages -1.6%.  In other words, “sell in May” is back on.
That’s not the last of it, however.  May 1 is actually not the ideal time to exit in a 2nd term election year.  That point is actually in June to July.  Here is a chart to illustrate what I mean.
SP500 vs. 2nd term Presidential Cycle
May in a 2nd term election year actually sees a bottom mid-month, and then a rally up into June and July.  The final top of that rally is ideally due July 10. 
The SP500 had not been following that 2nd term election year pattern very well, going wildly off track in August 2015 with the China-induced mini-crash.  But over the past few months, the market seems to have gotten back on track again, albeit with the dance steps of its price patterns arriving about a week earlier than scheduled.  That would mean the upcoming bottom which is ideally due around May 19-23 should appear roughly a week earlier.  And it also means that we should still expect another strong up move into late June or early July before the doubts about the impending election start to become a significant negative factor.
Tom McClellan
Editor, The McClellan Market Report
www.mcoscillator.com
(253) 581-4889 

Keep following JustSignals using Twitter, @StockTwits or Follow By Email. 
Just submit your email address in the box on the Blog homepage
This has been posted for Educational Purposes Only.   Do your own work and consult with Professionals before making any investment decisions.  
Past performance is not indicative of future results

Chaikin charts: DIA JNK SPY TBT XIV

Courtesy of ChaikinAnalytics.com


Courtesy of ChaikinAnalytics.com
ChaikinAnalytics.com
The above charts are in the OS area.  Most are above their MA.  Most show positive divergence and some have positive price patterns. 

Additionally, the % of DJIA stocks above the 10DMA, just posted this morning, is also oversold.  Picasso is at the end of it's low forecast period and is now entering it's high forecast period.

In summary, best case scenario would be for some positive action into the Picasso high dates of 5/7-17 +/- and then a sell off into mid year (Picasso's next date 6/17+/-) to flush out the bulls and to get more bearish sentiment so the second half of the year can grind to the upside into a Long Term top around Dec 2016 +/-.   This top/high could make new marginal highs in "some" but not all indexes, but it is not necessary for that to happen.

More on this as the market unfolds.

Keep following JustSignals using Twitter, @StockTwits or Follow By Email. 
Just submit your email address in the box on the Blog homepage
This has been posted for Educational Purposes Only.   Do your own work and consult with Professionals before making any investment decisions.  
Past performance is not indicative of future results

AAII Bullish %

Aubie Baltin CFA, CTA, CFP, PhD. and writer of the market newsletter, UNCOMMON COMMON SENSE,  once wrote that the stock market tends to rally for approx 3-6 months when the AAII bullish reading is under 25.

May 4,2016 = 22.30

If Aubie Baltin is correct, it certainly agrees with the suggestions of the Intermediate term cycles, mid year weakness then a positive second half.  Remember the February 20016 Escape Thrust and it's future 12 months effects on the stock market.  
See     bit.ly/1We8SBi

*Also note that June +/- is one of the weakest months of the year for the stock market and we are entering a period of weakness suggested by the Average 4th Years of the Average Election Years Cycle and the Average 8th Years of the two term Presidential Cycle.


Keep following JustSignals using Twitter or Follow By Email.
Just submit your email address in the box on the Blog homepage
This has been posted for Educational Purposes Only.   Do your own work and consult with Professionals before making any investment decisions. 

Past performance is not indicative of future results

chart: % of DJIA above 10DMA

Courtesy of IndexIndicators.com
Keep following JustSignals using Twitter, @StockTwits or Follow By Email. 
Just submit your email address in the box on the Blog homepage
This has been posted for Educational Purposes Only.   Do your own work and consult with Professionals before making any investment decisions.  
Past performance is not indicative of future results

chart: SPX LT signal

Courtesy of @TeddyVallee & pervallee.com

Keep following JustSignals using Twitter, @StockTwits or Follow By Email. 
Just submit your email address in the box on the Blog homepage
This has been posted for Educational Purposes Only.   Do your own work and consult with Professionals before making any investment decisions.  
Past performance is not indicative of future results

Thursday, May 5, 2016

charts: $SPX:$VIX & $XII

Courtesy of StockCharts.com

Courtesy of StockCharts.com

Keep following JustSignals using Twitter, @StockTwits or Follow By Email. 
Just submit your email address in the box on the Blog homepage
This has been posted for Educational Purposes Only.   Do your own work and consult with Professionals before making any investment decisions.  
Past performance is not indicative of future results

Wednesday, May 4, 2016

What is Picasso Saying?

This earlier post is being repeated again since nothing has changed much since and the Picasso dates have been accurate, "so far".

This was posted on February 21,2016 & March 29,2016 & April 25,2016:
Again, Picasso is not displaying any swings going forward for the DJIA.  So it is not easy to interpret a near flat line with an upward bias into April & "maybe" May.  But, GE is the only stock left in the Dow30 that is one of the original DJIA stocks.  Although the price charts of GE & the DJIA are not similar, their changes in trend have been similar in the past.  Due to this similar trend between GE & the DJIA, it is best that Picasso's readings for GE be used temporarily as a proxy for the DJIA.

In looking back we can see that Picasso was able to look into March and April and see that the rally should continue higher and it did.  Picasso is now approaching potential turn dates.  Below are dates that are now appearing after the, as described above, "a near flat line with an upward bias into April & "maybe" May".

Picasso's dates are always +/-

April 7 to 12 - low             Low hit during Picasso dates
April 20 to 25 - high          High hit during Picasso dates
April 29 to May 2 - low      Low hit during Picasso dates
May *7 to 17 - high         
June *17 - low

Intermediate cycles - Late April early *May high & *June +/- low

* = potentially important dates


Keep following JustSignals using Twitter, @StockTwits or Follow By Email. 
Just submit your email address in the box on the Blog homepage
This has been posted for Educational Purposes Only.   Do your own work and consult with Professionals before making any investment decisions.  
Past performance is not indicative of future results

Monday, May 2, 2016

chart: Earl & Earl2

By Danny of LunaticTrader.com

Stock markets have finally entered something more than a 2 day pullback. Last week’s advice to step aside works out fine so far. Now the next challenge is to watch for signs of a bottom. Let’s have a look at the Nasdaq chart:

Courtesy of LunaticTrader.com
All my indicators keep pointing down, with bearish divergences still in place. So, I wouldn’t rush back in just yet. This pullback or correction may continue for several weeks or months, but there will also be strong up days. A correction target in the 4600-4700 area would be fairly normal given the 800 point rally from the February lows. A deeper drop would indicate that a retest of the February lows is likely. It is too early to tell which scenario will unfold.

Keep following JustSignals using Twitter, @StockTwits or Follow By Email. 
Just submit your email address in the box on the Blog homepage
This has been posted for Educational Purposes Only.   Do your own work and consult with Professionals before making any investment decisions.  
Past performance is not indicative of future results