On a Japanese Candlesticks weekly chart of the S&P500, we had a shooting star this week...
This a bearish reversal pattern...Look it up on StockCharts.com - ChartSchool - Introduction to Candlesticks...
In addition, the high of the S&P500 this week was higher than last weeks high and the close this week was below last weeks close...
This is "usually" a sign of distribution...and there "maybe" a lot of buying climaxes this week...
On Monday Investors Intelligence will report the buying and selling climaxes for this week...
Past performance is not indicative of future results.
Friday, January 28, 2011

Wednesday, January 26, 2011
TNA...New Signal Today @ the Closing Bell

Of a total of 15 trades, 9 were winners and 6 were losses...
We will have losses, but we try to minimize them...
Past performance is not indicative of future results.
Tuesday, January 25, 2011
Long & Short Mutual Funds Ratio
This is updated from the December 11, 2010 posting...
This chart is from March 2009 to the present...It is the ratio of the market cap in long funds divided by the market cap in long funds plus the market cap in short funds...
Note that this ratio is currently higher than the level it was in April 2010 before the market corrected into July 2010...
This does not mean that the market has to correct now, it can advance from here, but, we should exercise some caution...Note that the market will always do what the market wants to do...It will always try to leave the station with the fewest number of people on board as possible...
We are still holding our short position from the Trend Following Signal of January 19,2011 and we will wait for a new signal before we reverse our position...
Past performance is not indicative of future results.
Monday, January 24, 2011
Precious Metals....OB/OS Update

Updated from December 12,2010...
This chart starts at March 2009...
Turquoise = precious metals mutual fund...note that after investors sharp redemption's, a bottom in the price of gold formed (this chart does not have the price chart for gold...please compare this chart to a gold chart and match up the dates)...It is easier to spot bottoms than tops...
Again there were a lot of redemption's in this Precious Metals mutual fund...
Past performance is not indicative of future results.
Thursday, January 20, 2011
TNA...New Signal Today @ the Closing Bell

At the closing bell today (Jan 19th---> see chart above) we received a sell signal...
So from April 27,2010 through today the performance was 103% net of losses...
Of a total of 14 trades, 9 were winners and 5 were losses...
We will have losses, but we try to minimize them...
Past performance is not indicative of future results.
Tuesday, January 18, 2011
Stock Market Signals Update
Updated from January 2, 2011 post...
The last signal was a buy signal on December 1,2010...
We have not had another signal since then...
When we do get the next signal we will be posting it...
For those of you that are new to this blog, the signals are based on Trend Following...See the performance chart on the January 2,2011 post...
Note that the TNA today is about 78.62, intraday...The buy signal on Dec 1,2010, TNA was priced at 61.89...As of today that would have added about 27% to the performance for a total of 113% from April 27,2010 to today, net of losing trades...
Past performance is not indicative of future results.
Sunday, January 2, 2011
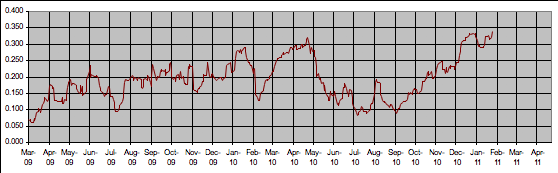
2011 New Strategy

So...this strategies last signal was a buy on Dec 1st...We now are waiting for the next sell signal...
Past performance is not indicative of future results.
TNA new signal
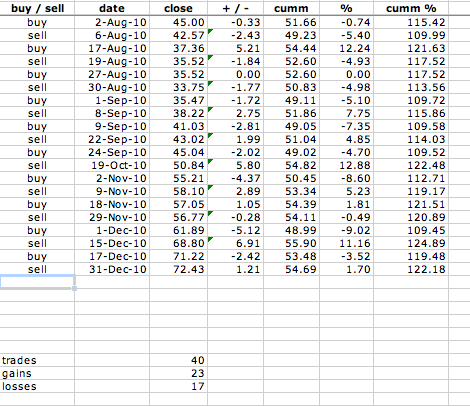
Over a period of 11 months we had 40 trades, 23 gains and 17 losses...Another post will explain our new strategy for 2011...
Past performance is not indicative of future results.
Subscribe to:
Posts (Atom)